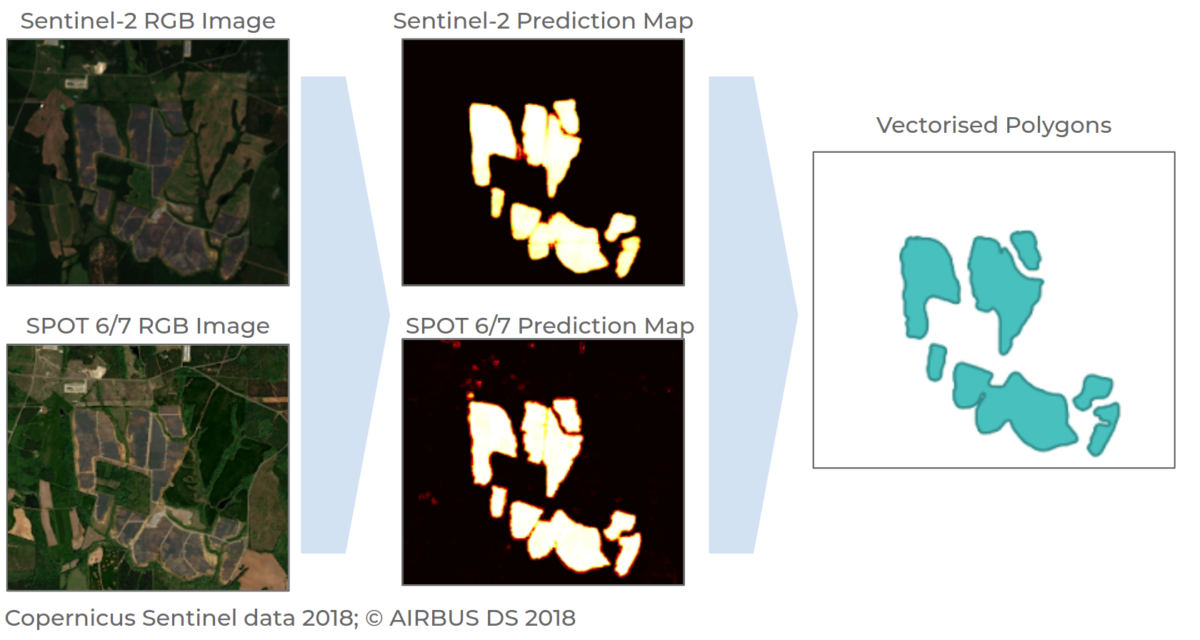
A group of researchers led by the University of Oxford has combined the use of remote sensing imagery with machine learning and a large cloud computation infrastructure to build a global inventory of PV installations with a power output of at least 10 kW.
“We don't distinguish between rooftop, ground-mounted or other types of installations,” the research's main author, Lucas Kruitwagen, told pv magazine. “We filtered our training, cross-validation, test, and predicted dataset for facilities less than this size, although not many facilities of this small size were detected.”
“It's not really a tool, we haven't done any downstream work other than the research to quantify the land-use impact,” the Oxford-based scientist said, describing the inventory, which can be found via several links, including visualization by ResourceWatch and for download on Zenodo. “The generic nature of our data means that many people can use it for different downstream tools and use cases.”

Image: University of Oxford
The global corpus of sensing imagery was built using cloud computation infrastructure developed by U.S.-based geospatial data company Descartes Lab. The search area was defined by dilating a global human population-density map and the resulting area measured 72.1 million square kilometers, which corresponds to around 48.4% of the Earth’s land surface area.
“Nominal alternating-current generating capacities of installations are estimated by using simple assumptions about installation tilt angle, ground coverage ratio, inverter loading ratio and panel efficiency,” the academics explained.
Popular content
Through the inventory, which also includes off-grid installations of more than 10 kW, the researchers were able to identify 68,661 facilities, totaling 423 GW across 31 countries. Of these PV arrays, 18,449 are located in China; 9,906 in Japan; 4,525 in the United States; 2,021 in India; and 17,918 in the European Economic Area. Sampling was made from a global land-cover map.
Image: University of Oxford
“We observe that non-residential PV is most commonly installed on croplands, followed by deserts and grasslands,” the research group stated. “Our observed installation dates can be used to generate insight into the gap between facility-level final investment decisions, construction start [dates], construction completion [dates] and facility [operations],” it further explained. “Our land-cover analysis provides insight into global trends for PV siting decisions.”
The global inventory is presented in the paper A global inventory of photovoltaic solar energy generating units, which was recently published in nature. The research team includes scientists from Descartes Labs and the World Resources Institute. “Future work to enhance the dataset should include temporal updates, improved installation geometries, better estimates of installation type, and its combination with residential solar PV datasets,” they emphasized.
This content is protected by copyright and may not be reused. If you want to cooperate with us and would like to reuse some of our content, please contact: editors@pv-magazine.com.


2 comments
By submitting this form you agree to pv magazine using your data for the purposes of publishing your comment.
Your personal data will only be disclosed or otherwise transmitted to third parties for the purposes of spam filtering or if this is necessary for technical maintenance of the website. Any other transfer to third parties will not take place unless this is justified on the basis of applicable data protection regulations or if pv magazine is legally obliged to do so.
You may revoke this consent at any time with effect for the future, in which case your personal data will be deleted immediately. Otherwise, your data will be deleted if pv magazine has processed your request or the purpose of data storage is fulfilled.
Further information on data privacy can be found in our Data Protection Policy.