The first results from the new pv magazine test were presented in the September issue, together with the detailed methodology and explanation of the letter grade system. Our initial design was to assign letter grades to the results, five in total, and the intention was to set the grade limits in such a way as to avoid a “top grade” congestion, as this would render the usefulness of the test meaningless.
As explained back in September, a host of advances and improvements in technologies at all fronts is already taking place, and is expected to accelerate in the PV industry in the next few years. The key performance indicators, based on inspection and test results on visual quality, cell quality, low light efficiency, PID loss, LID loss and temperature coefficients, will certainly exhibit a steep improvement curve, and this will happen sooner rather than later. Technologies that are in the process of becoming mainstream and entering mass production will affect all of these metrics. Mono PERC modules have better low light performance and improved power temperature coefficient, double glass frameless modules are less prone to PID and n-type cells have almost zero LID. If we set the bar too low now, there wouldn’t be room in the grade system to capture performance improvement down the road.
However, our method of using five letter grades created abrupt grade “cliffs”, so that a product would receive, for example, a B grade by testing marginally below the figures marking the grade boundary between A and B. Moreover, we faced a psychologically adverse effect from the manufacturers’ side, which we could describe as the “fear of getting anything less than A”. In summary, perfectly good, average performing modules, would score B or C grades in some tests, which, although it leaves the above described room for improvement, it would also create a misleading perception that these modules are of inferior quality to what is expected on average in the current manufacturing landscape.
As a result, and keeping to our commitment to continuously work closely with the PV industry to improve the test and establish it as a useful benchmarking tool, we decided to revise our grading system from the ground up to solve the aforementioned problems.
The new grades
First, we decided to employ a 1 – 100 grade range to more accurately and granularly depict the actual test results and avoid the “grade cliff” effect. Having 100 numerical grades instead of just five letter grades certainly achieves this goal. At the same time, we don’t have the B or C letter grade adverse psychological effect, which will, hopefully, further encourage the manufacturers to be more willing to publicize the test results.
A second step was to correlate the test results to the grades. As with the letter grades, special care was taken to ensure that the grading would leave room for improvements and not create a congestion at the top. For the grades to be meaningful and representative of the actual results, we picked the 100, 50 and 0 grades in such a way so that they correspond to the absolute best, average/acceptable and totally unacceptable test results. Table 1 (p.69) details this correlation.
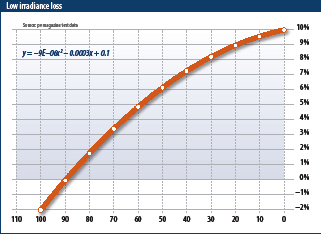
To illustrate the methodology used to correlate the test results with the grades, let’s take for example the low irradiance loss test. You can see from Table 1 that a loss of 6.16% would give a grade of 50, which is what one would expect from a standard technology, average to low quality module today. On the other hand, the perfect 100 grade is reserved for products that will have a 2% or higher gain, instead of loss. Unusual as this may sound, certain technologies, such as PERC, may exhibit a slightly positive gain at low irradiance. This is indeed one of the main factors of the reported higher energy yield of PERC modules compared to ones using conventional BSF (back surface field) cells. A similar methodology has been applied to the other tests and inspections. In all cases a quadratic curve fit was employed to extrapolate the correlation from the high, low and medium values to the rest of the range. The chart ‘Low irradiance loss’ (p.69) depicts the correlation between the low irradiance loss test results and the grades.
To calculate the average grade of a product over all tests, we applied a weighted average method (see Table 2, p.69), for the reasons explained in the September article. In the new system the weights remain the same, only this time they are applied on the new numerical grades instead of the letter grades.
Test results with new grades
The test results of Jolywood and Risen are presented again, but this time we applied the new grading system. There are further changes with respect to the September presentation, since Risen have agreed to have the full test results published, and the Jolywood product was additionally tested for PID at an increased system voltage of – 1,500 V. The other test participants have not agreed to release the results and will proceed with further testing after making improvements to the products.
Jolywood test results
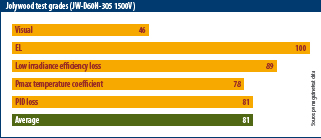
Table 3 (p.69) shows all the test results and grades for Jolywood’s double glass, bifacial n-PERT product and the chart ‘Jolywood test grades’ (p.69) plots the grades, including the average grade for all tests.
It’s interesting to note that the PID loss increased at the higher – 1,500 V bias, reaching 1.54%, whereas the loss at – 1,000 V was 0.48%. This result indicates that, even with double glass modules, high DC voltage system designers must still take PID risk into account. It’s worth noting again the excellent behavior of the product under low irradiance and its very good power temperature coefficient. The double glass enclosed n-PERT cells had zero cracks and no other EL defects and got a perfect 100 grade. However, the somewhat low visual score shows that there is still room for “low hanging fruit” improvements here.
Risen test results
Table 4 (above) shows all the test results and grades for Risen’s framed, multi BSF product and the corresponding chart plots the grades, including the average grade for all tests.
Taking into consideration that Risen’s module uses conventional multi BSF cells, the test results are in line with what one would expect from mass produced modules of this type.
The uniformity of the product’s performance across all tests is obvious from the chart, where there is only a mild grade variation. The very good average grade of 76 depicts the overall performance of Risen’s product.
Test result comparison
The chart ‘Test grade comparison’ (above) compares Jolywood’s and Risen’s grades for each test. From the chart, two important observations can be made : n-type PERT double glass modules have a great potential for increased performance.
The uniform grades of conventional, mass manufactured products across all tests is a result of the consistency of the products, but it also signifies that the grading range has been constructed with conventional module performance in mind. As the performance envelope expands, we may have to review the grading system to improve the way results are perceived.
Jolywood’s n-PERT double glass module shows a clear advantage, and a potential for improvement. However, Risen’s conventional module is not lagging far behind.
As we all know, in the very competitive PV industry, and especially in the large scale, utility sector, procurement decisions are made primarily on grounds of price. New technologies attempt to reach higher performance, but this typically comes at a higher cost. The challenge for these technologies is to achieve the scale and maturity that will allow them to narrow the cost difference with respect to conventional ones and improve the LCOE.
Fortunately, there are good signs that this is already starting to happen, and we hope to see more innovative products in future test rounds.
Author: George Touloupas
This content is protected by copyright and may not be reused. If you want to cooperate with us and would like to reuse some of our content, please contact: editors@pv-magazine.com.