AleaSoft Energy Forecasting, November 2, 2021. The photovoltaic energy production fell in October due to the decrease in solar radiation, but it increased compared to October 2020 because of the increase in installed capacity, while the electricity demand decreased compared to the previous year. Gas prices continued to rise during most of the month and pushed electricity markets prices to record highs in October. For the first time this year, CO2 prices fell, although they are still above 2020’s values.
Photovoltaic and solar thermal energy production and wind energy production
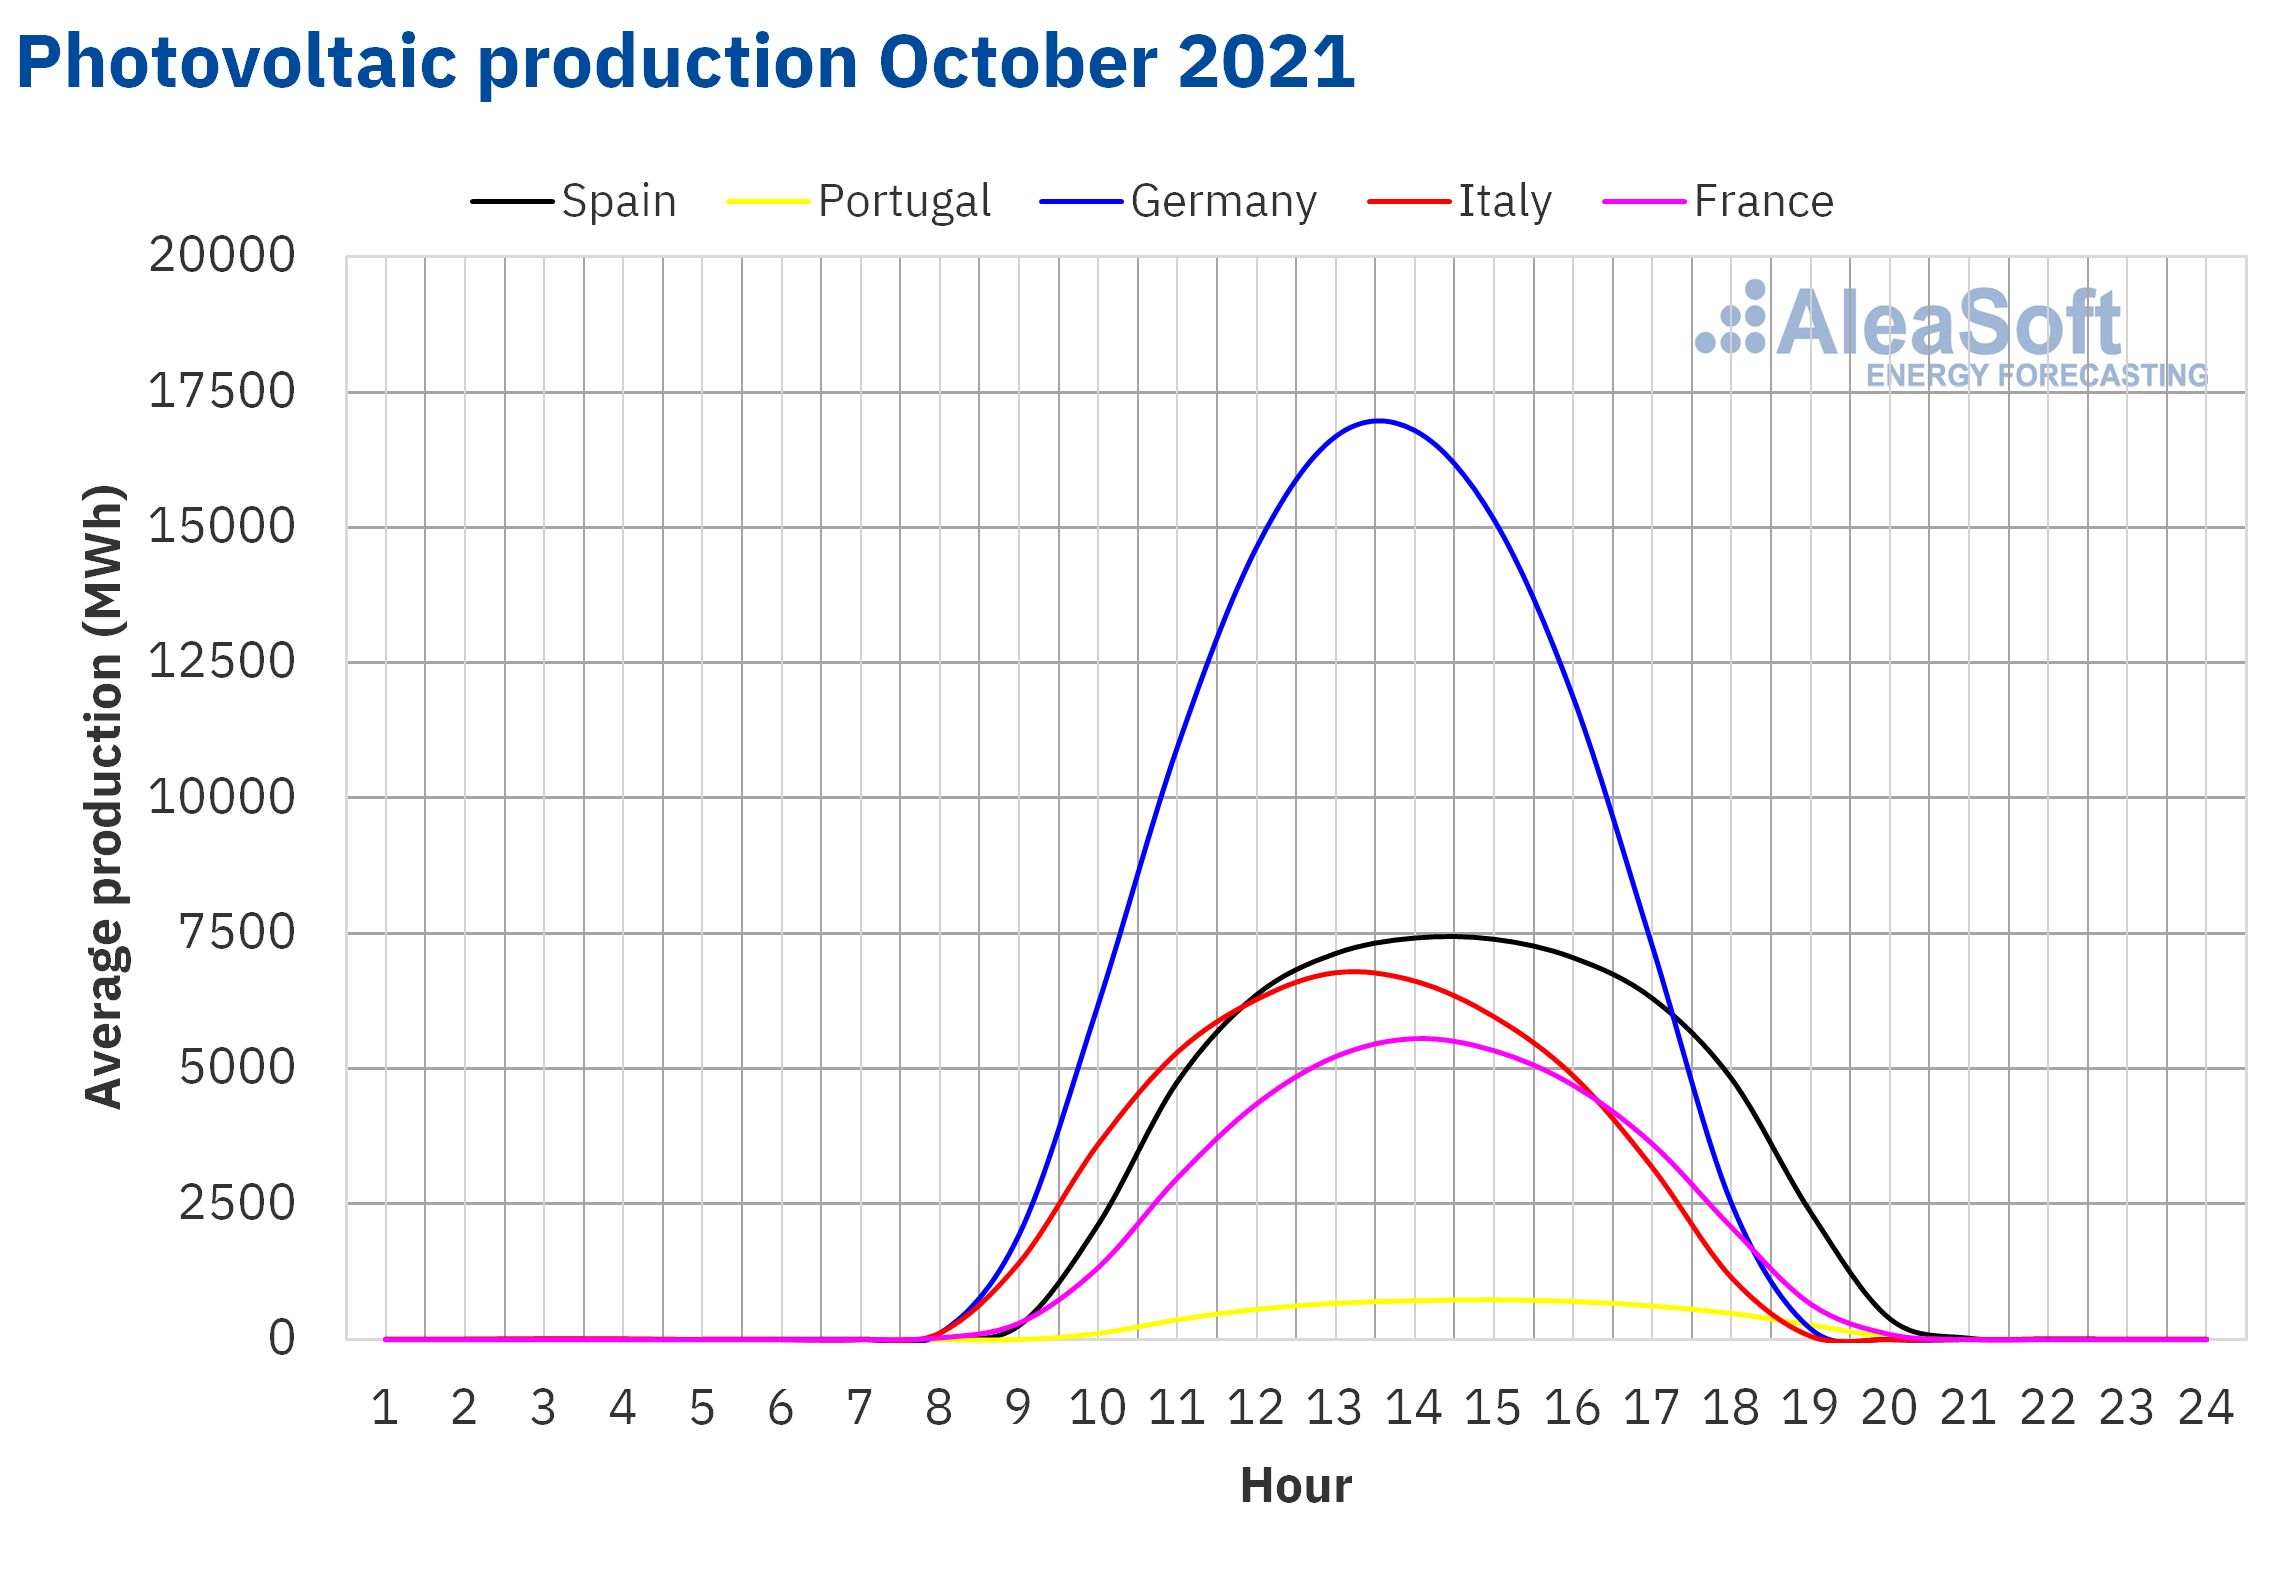
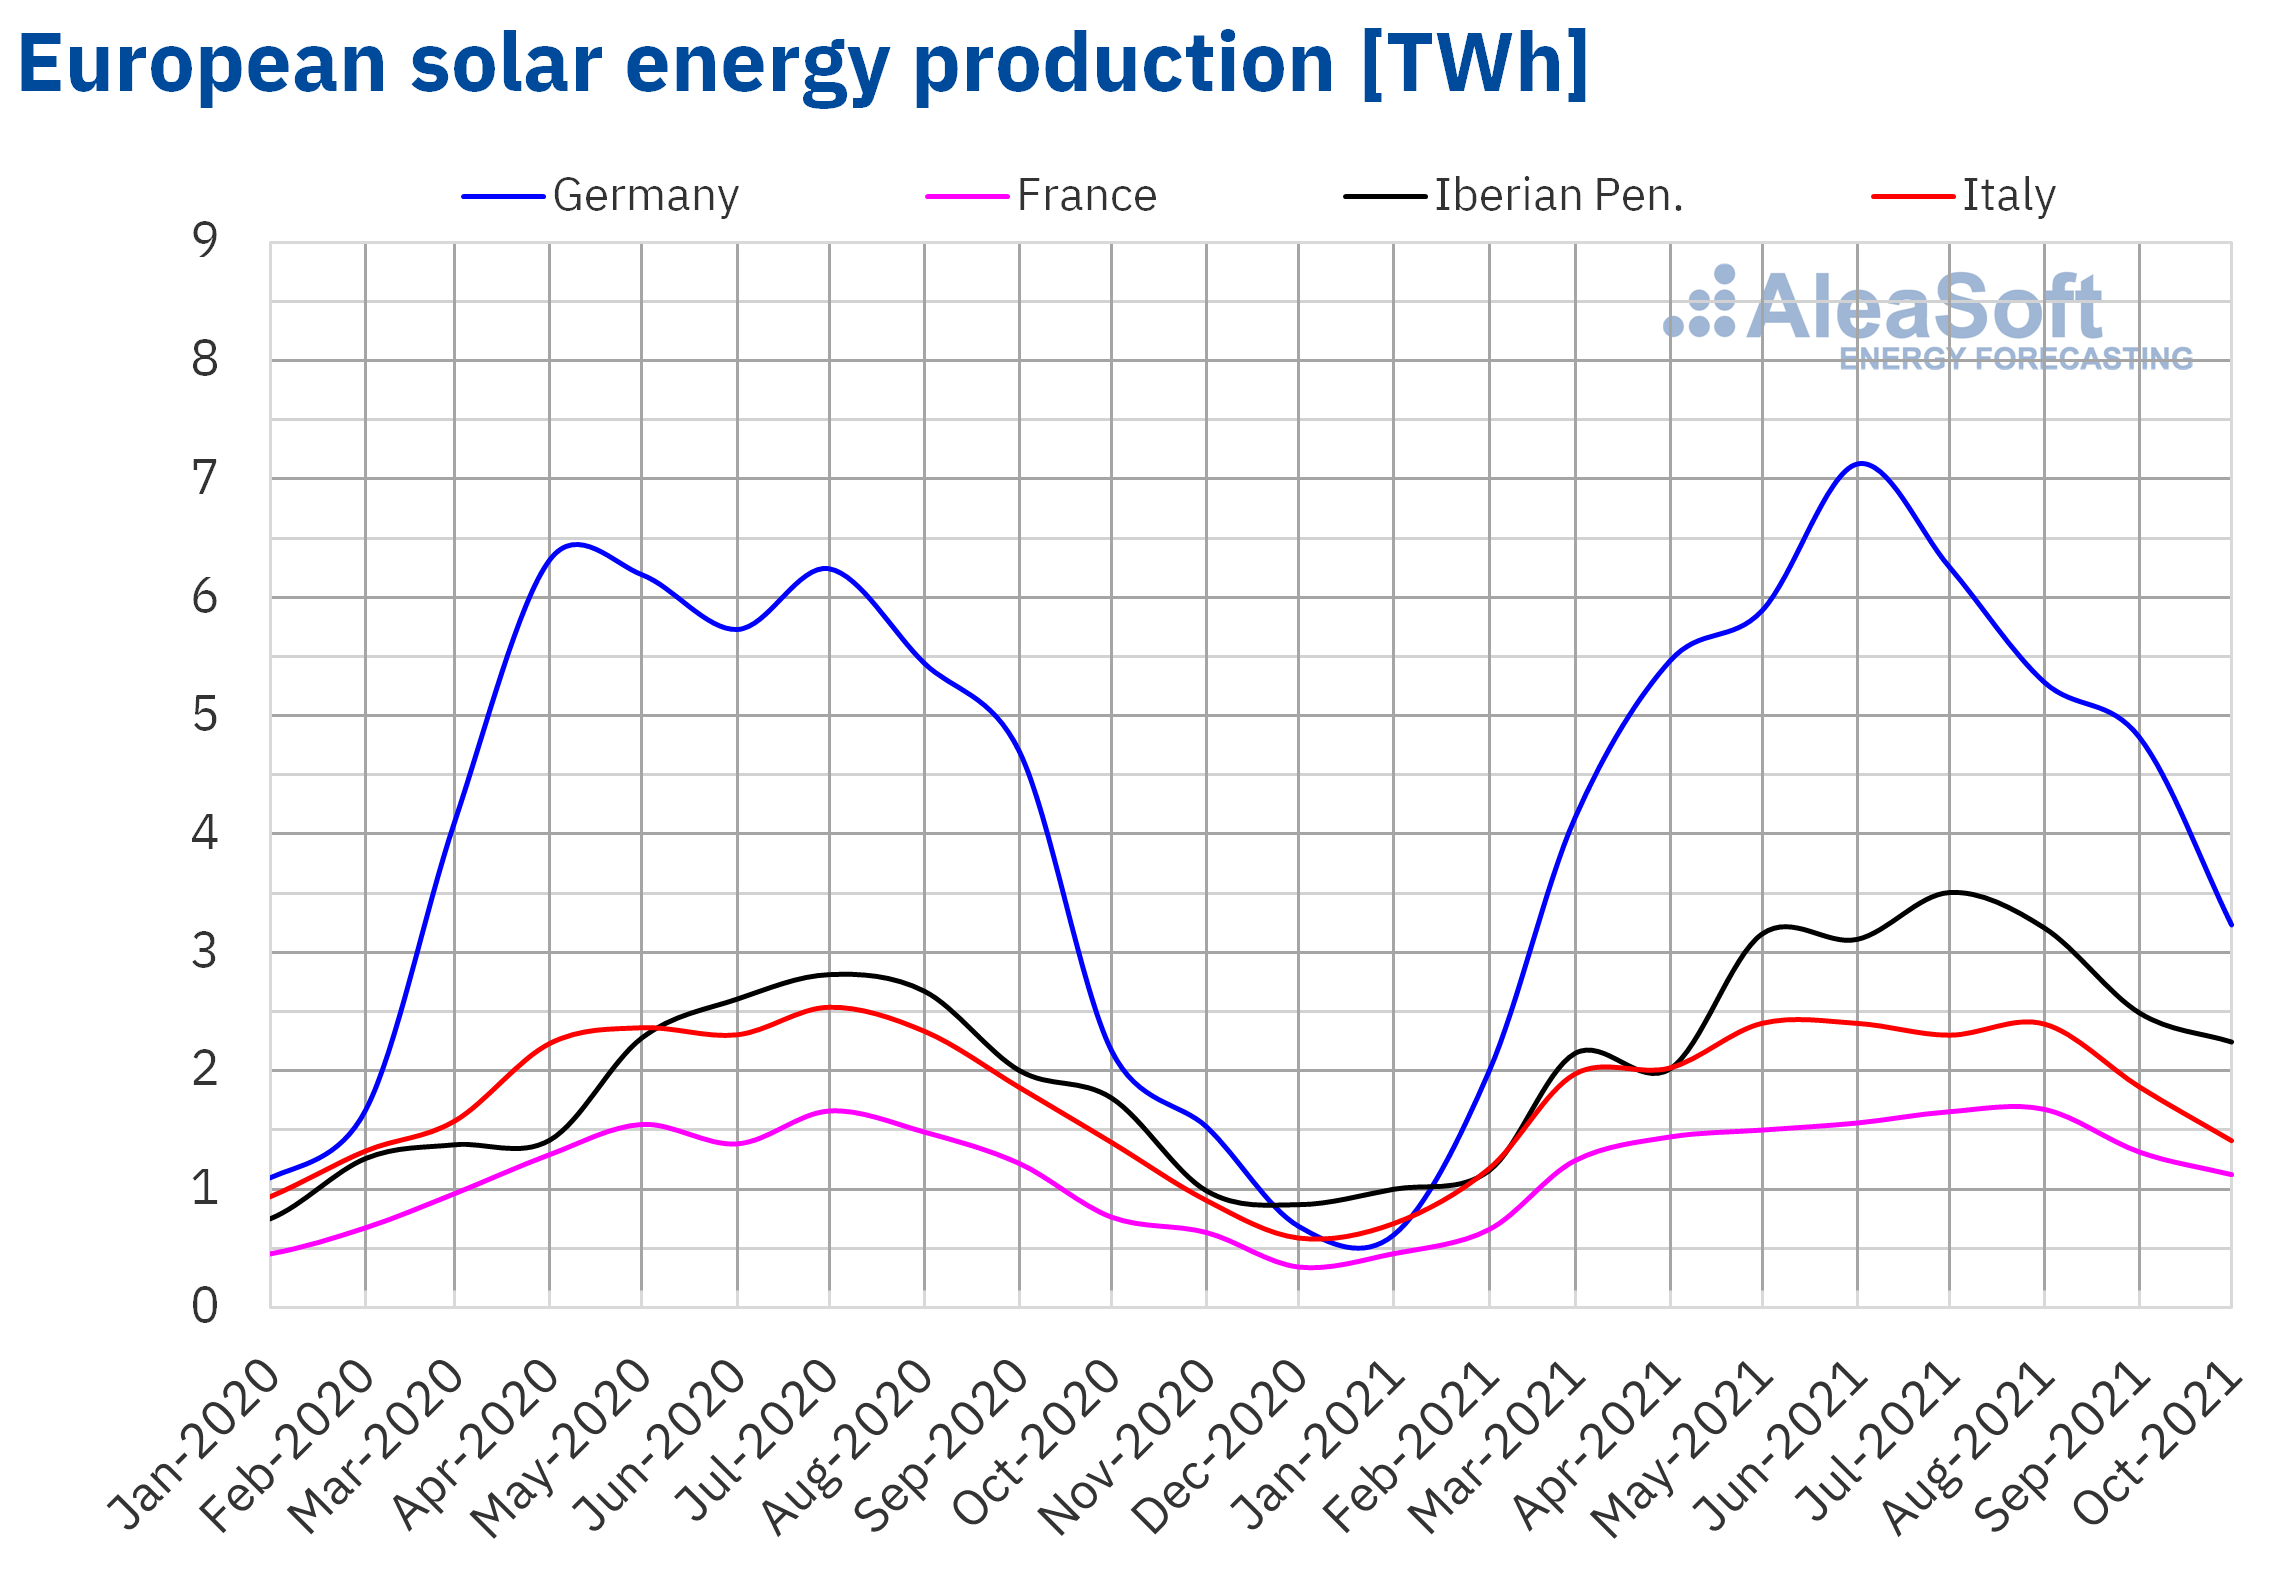
The solar energy production during the month of October continued its seasonal downward trend due to the decrease in solar radiation as the winter solstice approaches. The drop in production in October compared to September reached 35% in Germany, followed by Italy, with a 27% drop, and by France, with 17%. In the Iberian Peninsula, due to its location further south of the continent, the monthly decrease in solar energy production was somewhat lower, with drops of 13% in Spain and 8.7% in Portugal.
But the interesting comparison is with the month of October 2020. Here a clear increase in solar energy production in the main European markets can be seen, a consequence of the increase in installed solar photovoltaic energy capacity in the last twelve months. Among the countries with the highest year‑on‑year increase in solar energy production are Germany, with a production growth of 49%, France, with 47% and Portugal, with 45%. At another level are Spain, with an increase of 28% and Italy with an increase of only 1.0%.
 Source: Prepared by AleaSoft Energy Forecasting using data from ENTSO-E, RTE, REN, REE and TERNA.
 Source: Prepared by AleaSoft Energy Forecasting using data from ENTSO-E, RTE, REN, REE and TERNA.
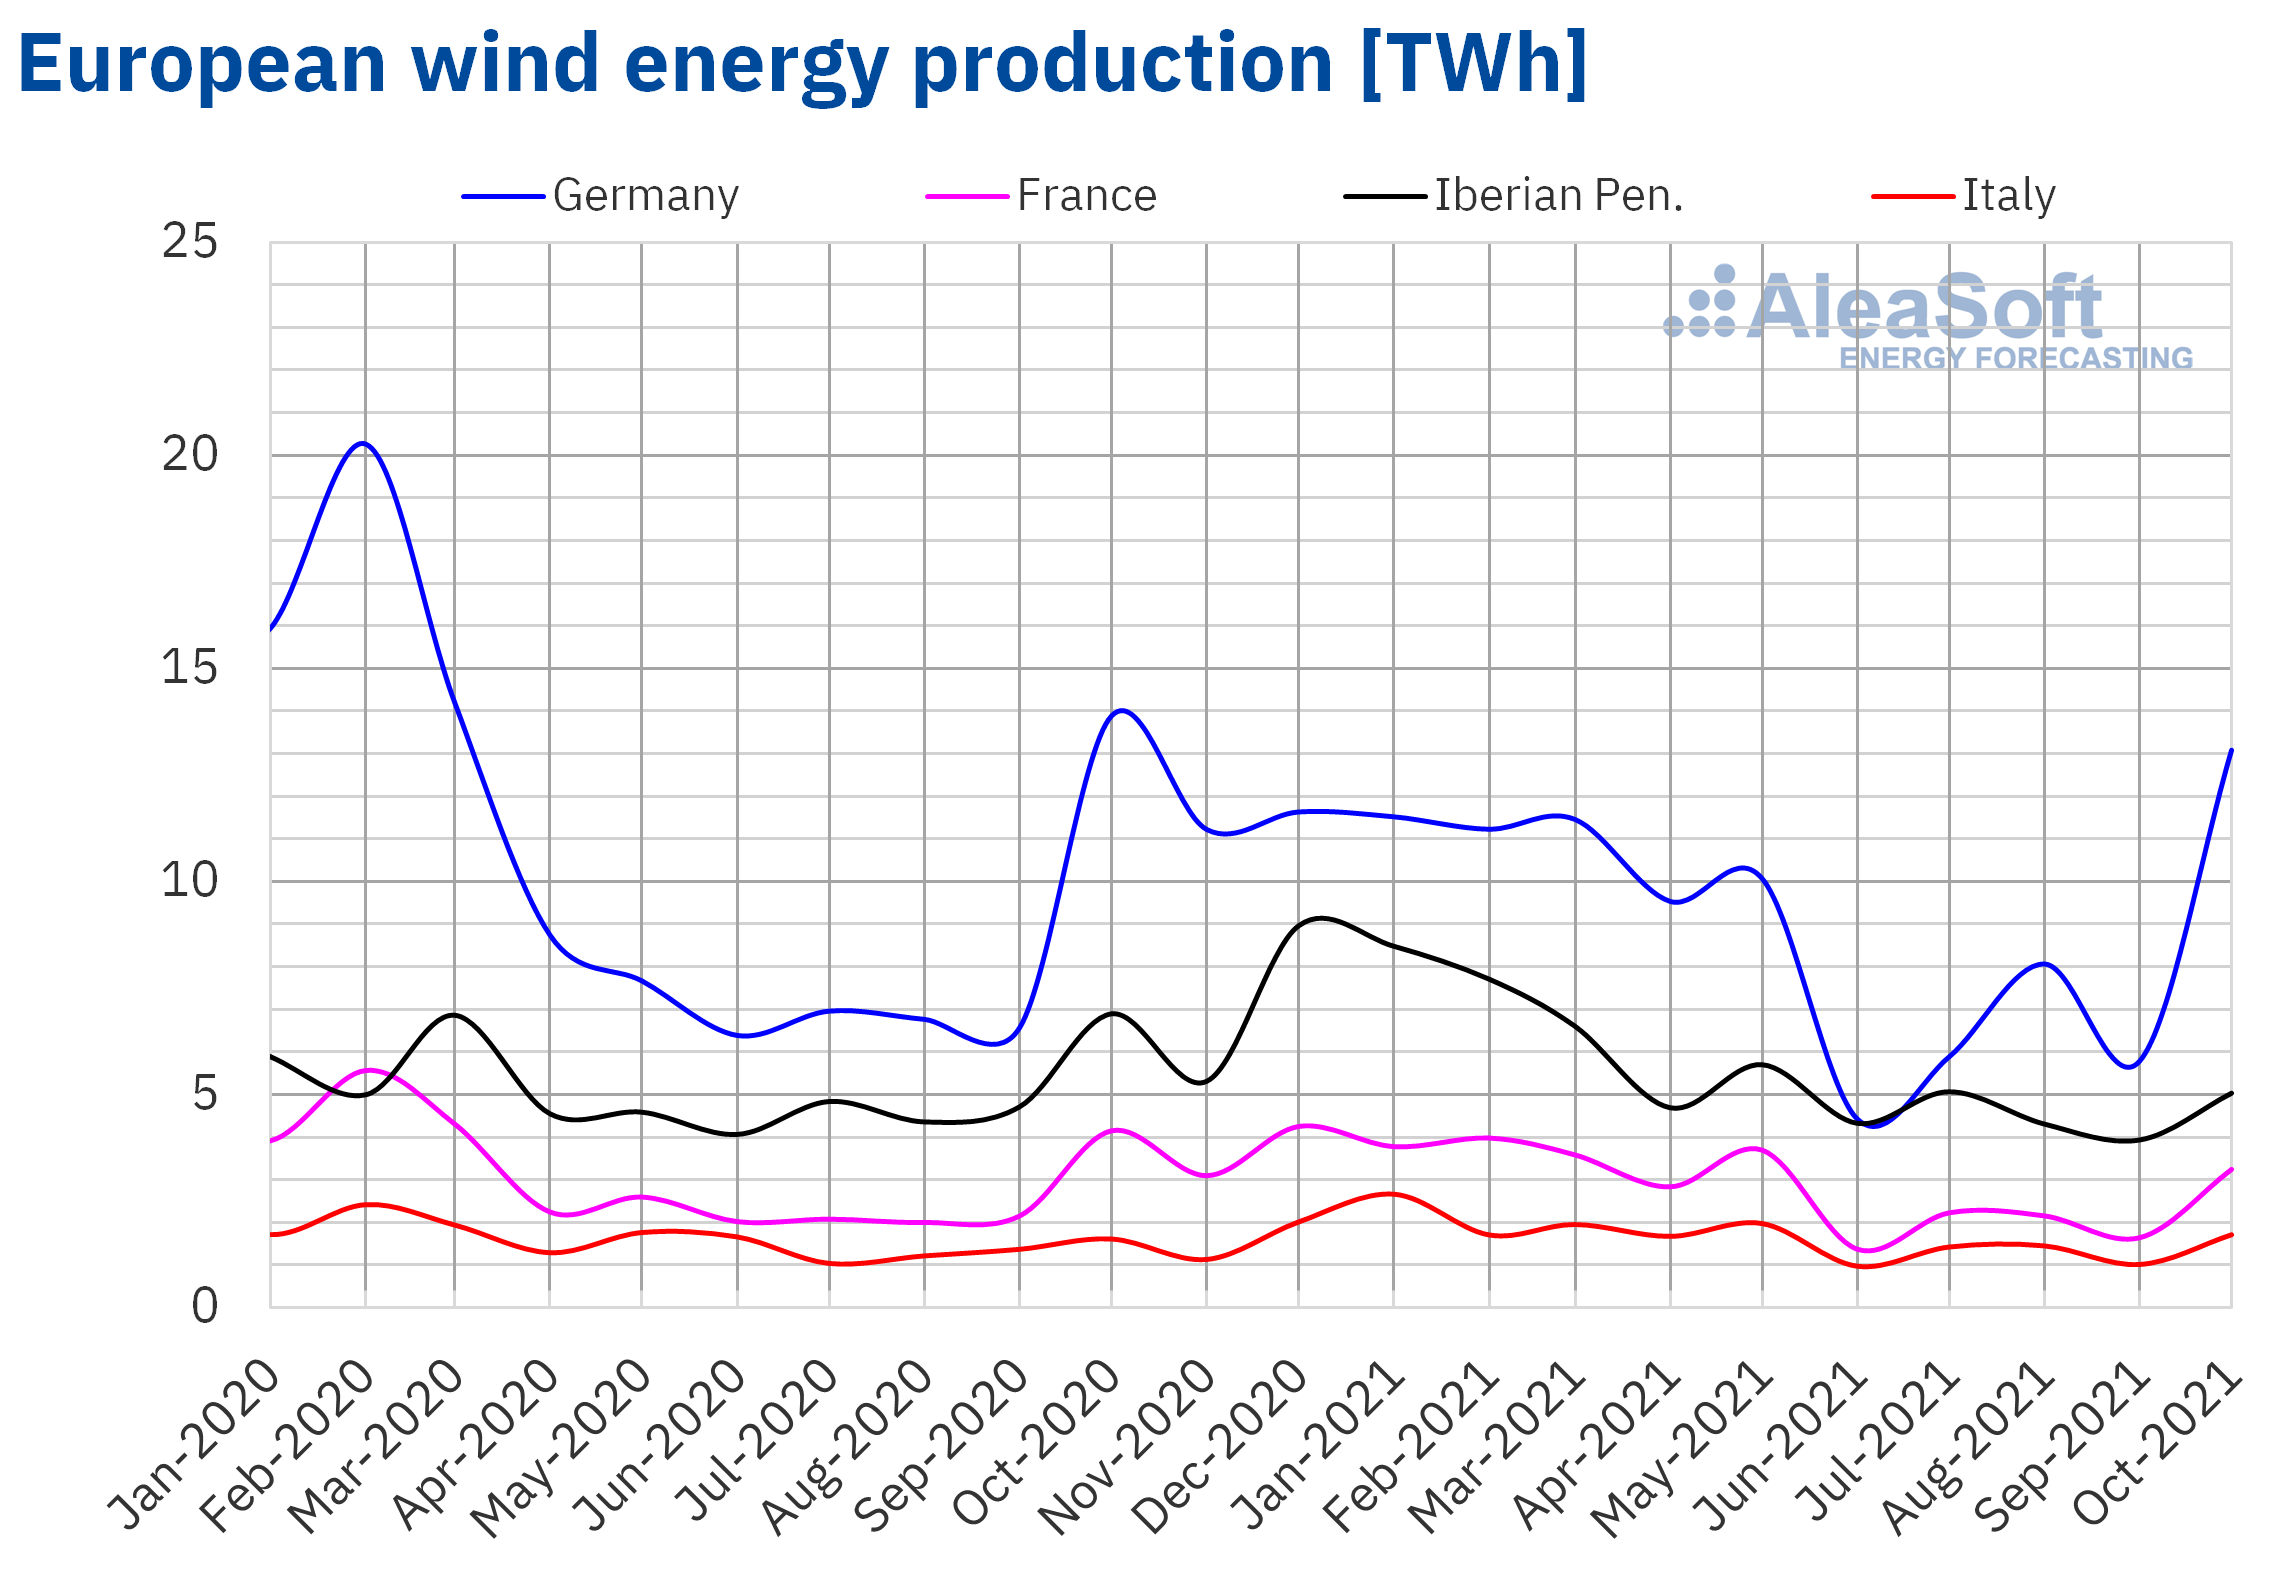
In the case of the wind energy production, October is traditionally a month of production recovery after the summer period. In Germany, the production in October increased by 119% compared to the production of September. In France, the increase reached 91%, in Italy, it was 64% and in Spain, 30%. In the case of Portugal, there was a decrease of 1.1%.
In the year‑on‑year comparison with October 2020, wind energy production registers were generally moderate. Italy leads the comparison with a year‑on‑year increase in production of 6.2%. It is followed by Germany, with a fall of 5.8%, and France, with a reduction of 22%.
In this October 2021, in the Iberian Peninsula, low wind energy productions were registered for the time of year and the installed capacity. In Spain, the production decreased by 26% compared to October 2020, and in Portugal, by 33%. In the peninsula as a whole, the fall in wind energy production stood at 27%.
 Source: Prepared by AleaSoft Energy Forecasting using data from ENTSO-E, RTE, REN, REE and TERNA.
Electricity demand
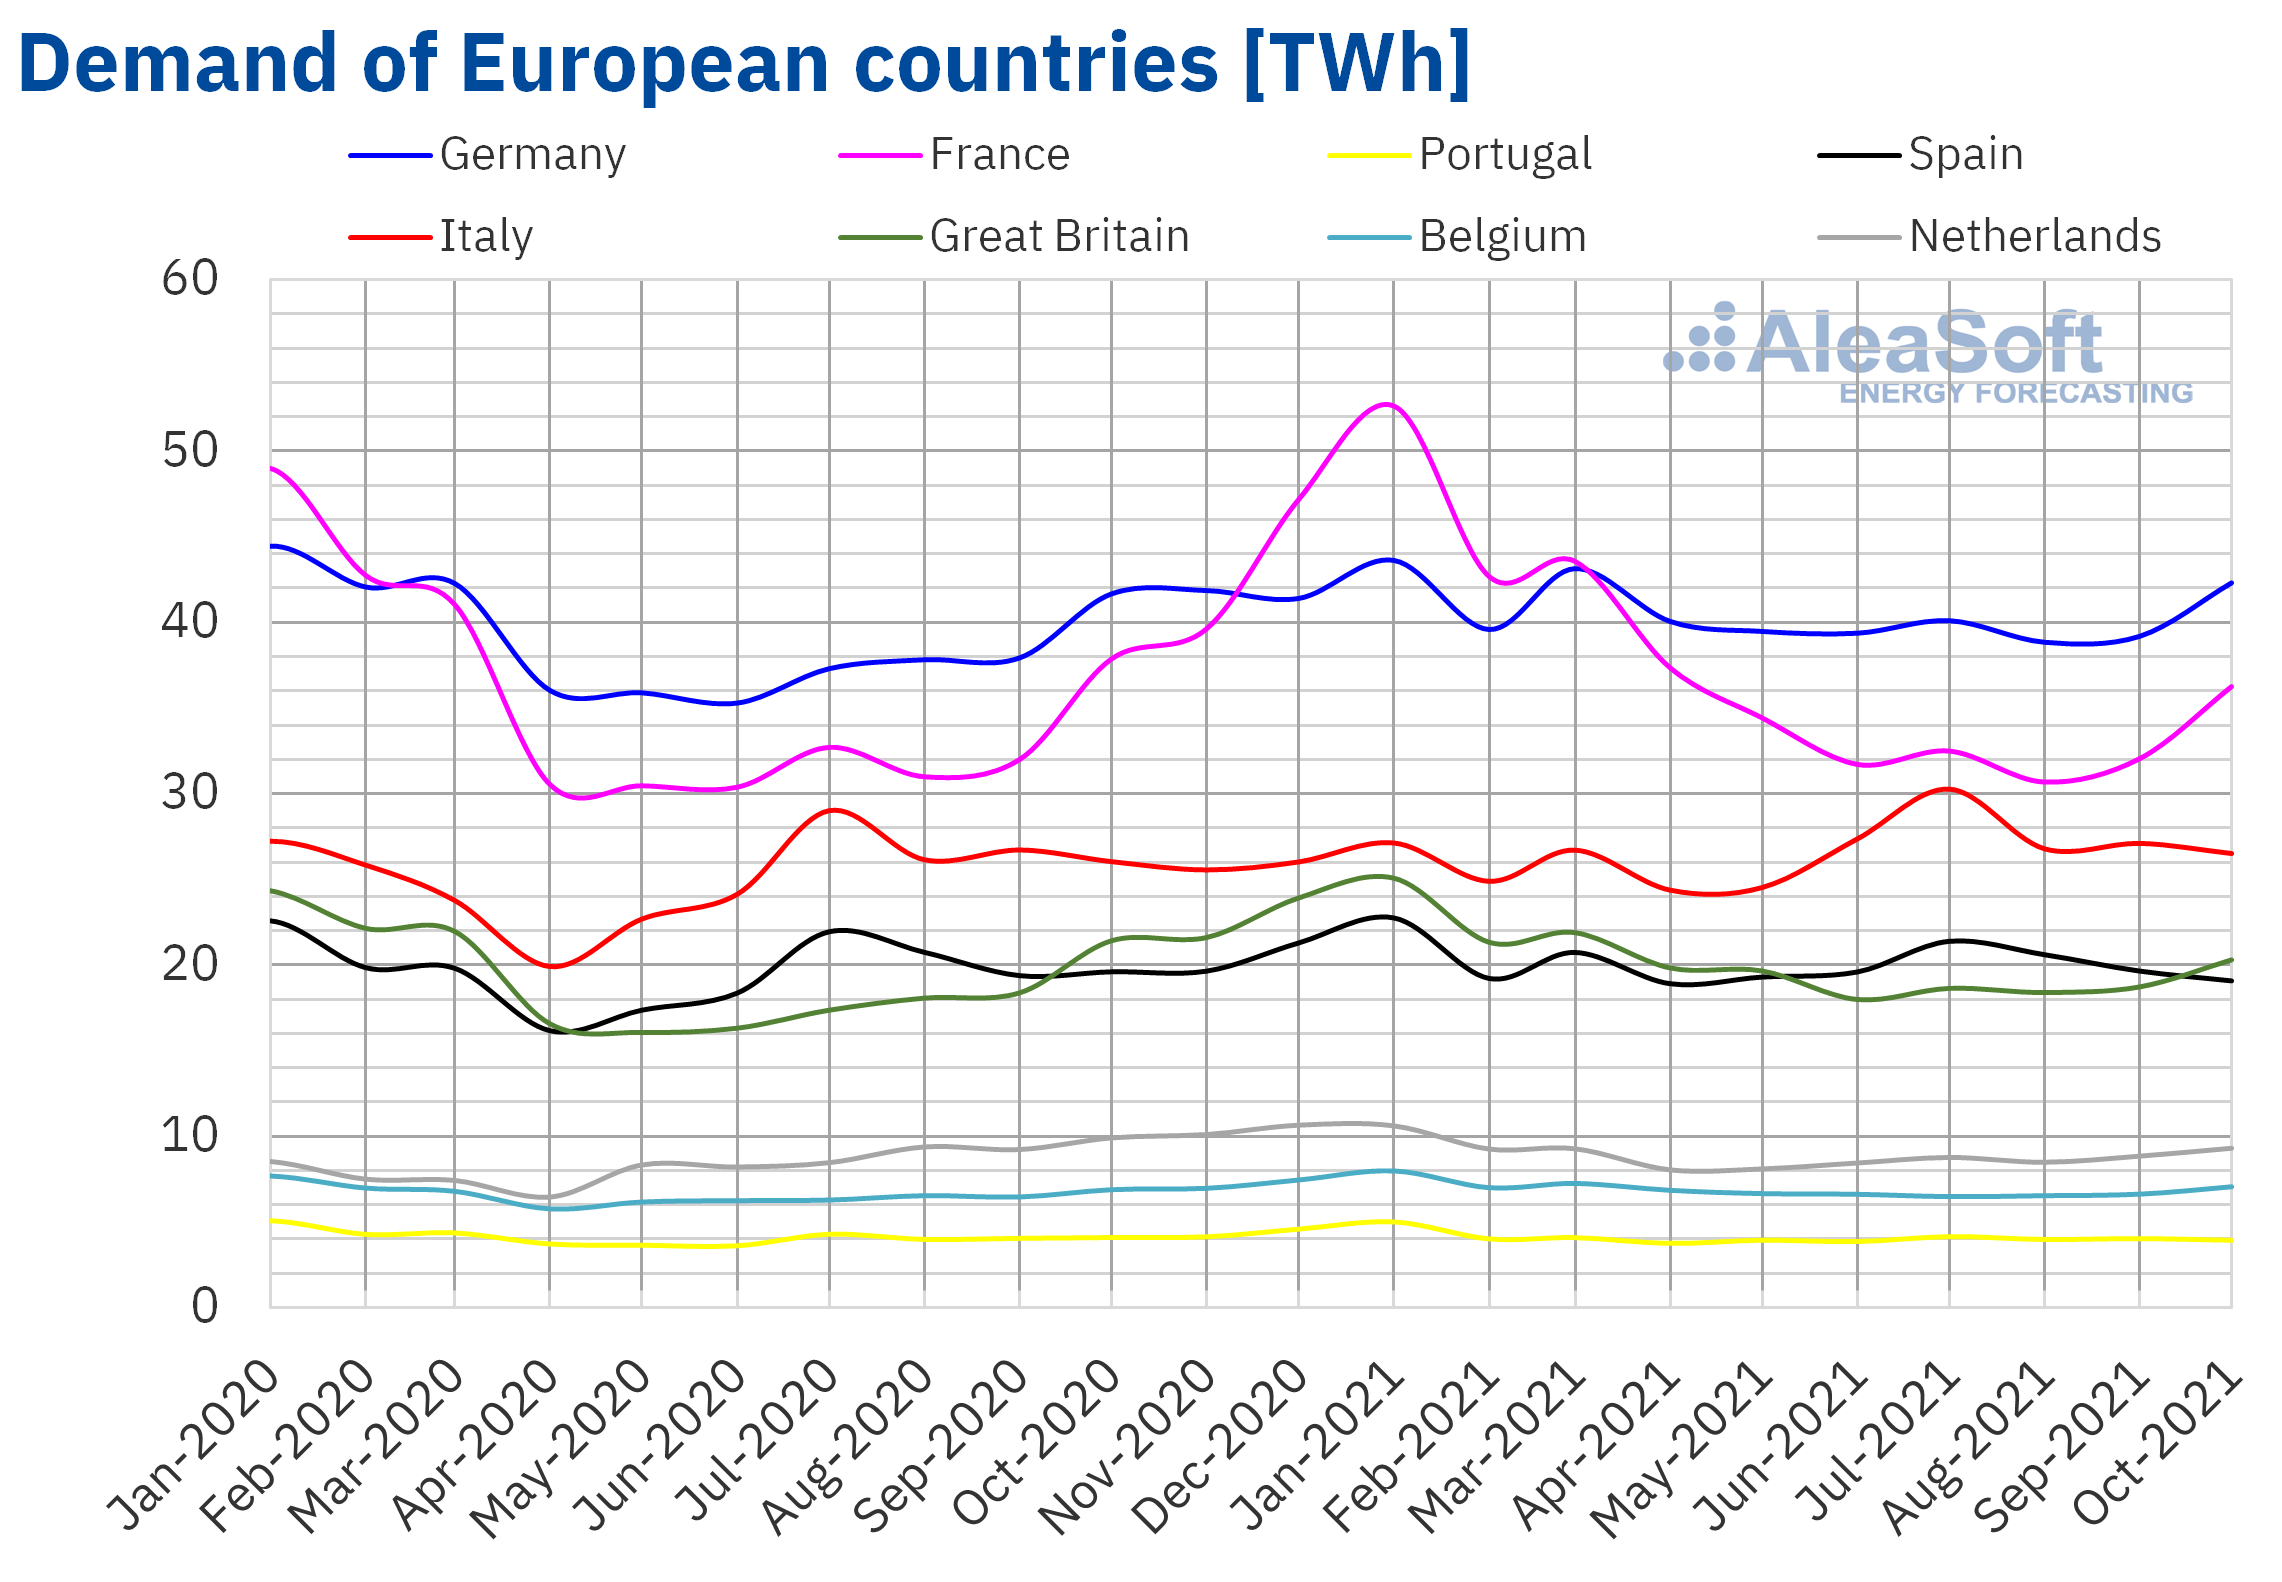
The electricity demand registered decreases in most European markets during the month of October 2021 compared to October 2020. Average temperatures for the tenth month of 2021 were generally higher than those of the same period of the previous year, with increases of up to 1.8 °C in the Portuguese market. The main drops in demand occurred in the markets of the Netherlands and Great Britain, which were 6.2% and 5.2% respectively. In the Spanish market the decrease was 2.7%. When correcting effects of labour and temperature, the fall in Spain was 1.7%, according to data from Red Eléctrica de España (REE). On the other hand, in Germany, Italy and Belgium there were year‑on‑year increases lower than 2.5%.
Comparing with the previous month, the behaviour during October was quite different from that of the year‑on‑year comparison, and increases in demand were registered in most markets. In this case, the most significant increases were in the markets of France and Great Britain, which registered increases of 9.5% and 4.9% respectively. However, some markets registered decreases, such as Spain and Portugal, which were 6.1% and 5.6% respectively.
 Source: Prepared by AleaSoft Energy Forecasting using data from ENTSO-E, RTE, REN, REE, TERNA, National Grid and ELIA.
European electricity markets
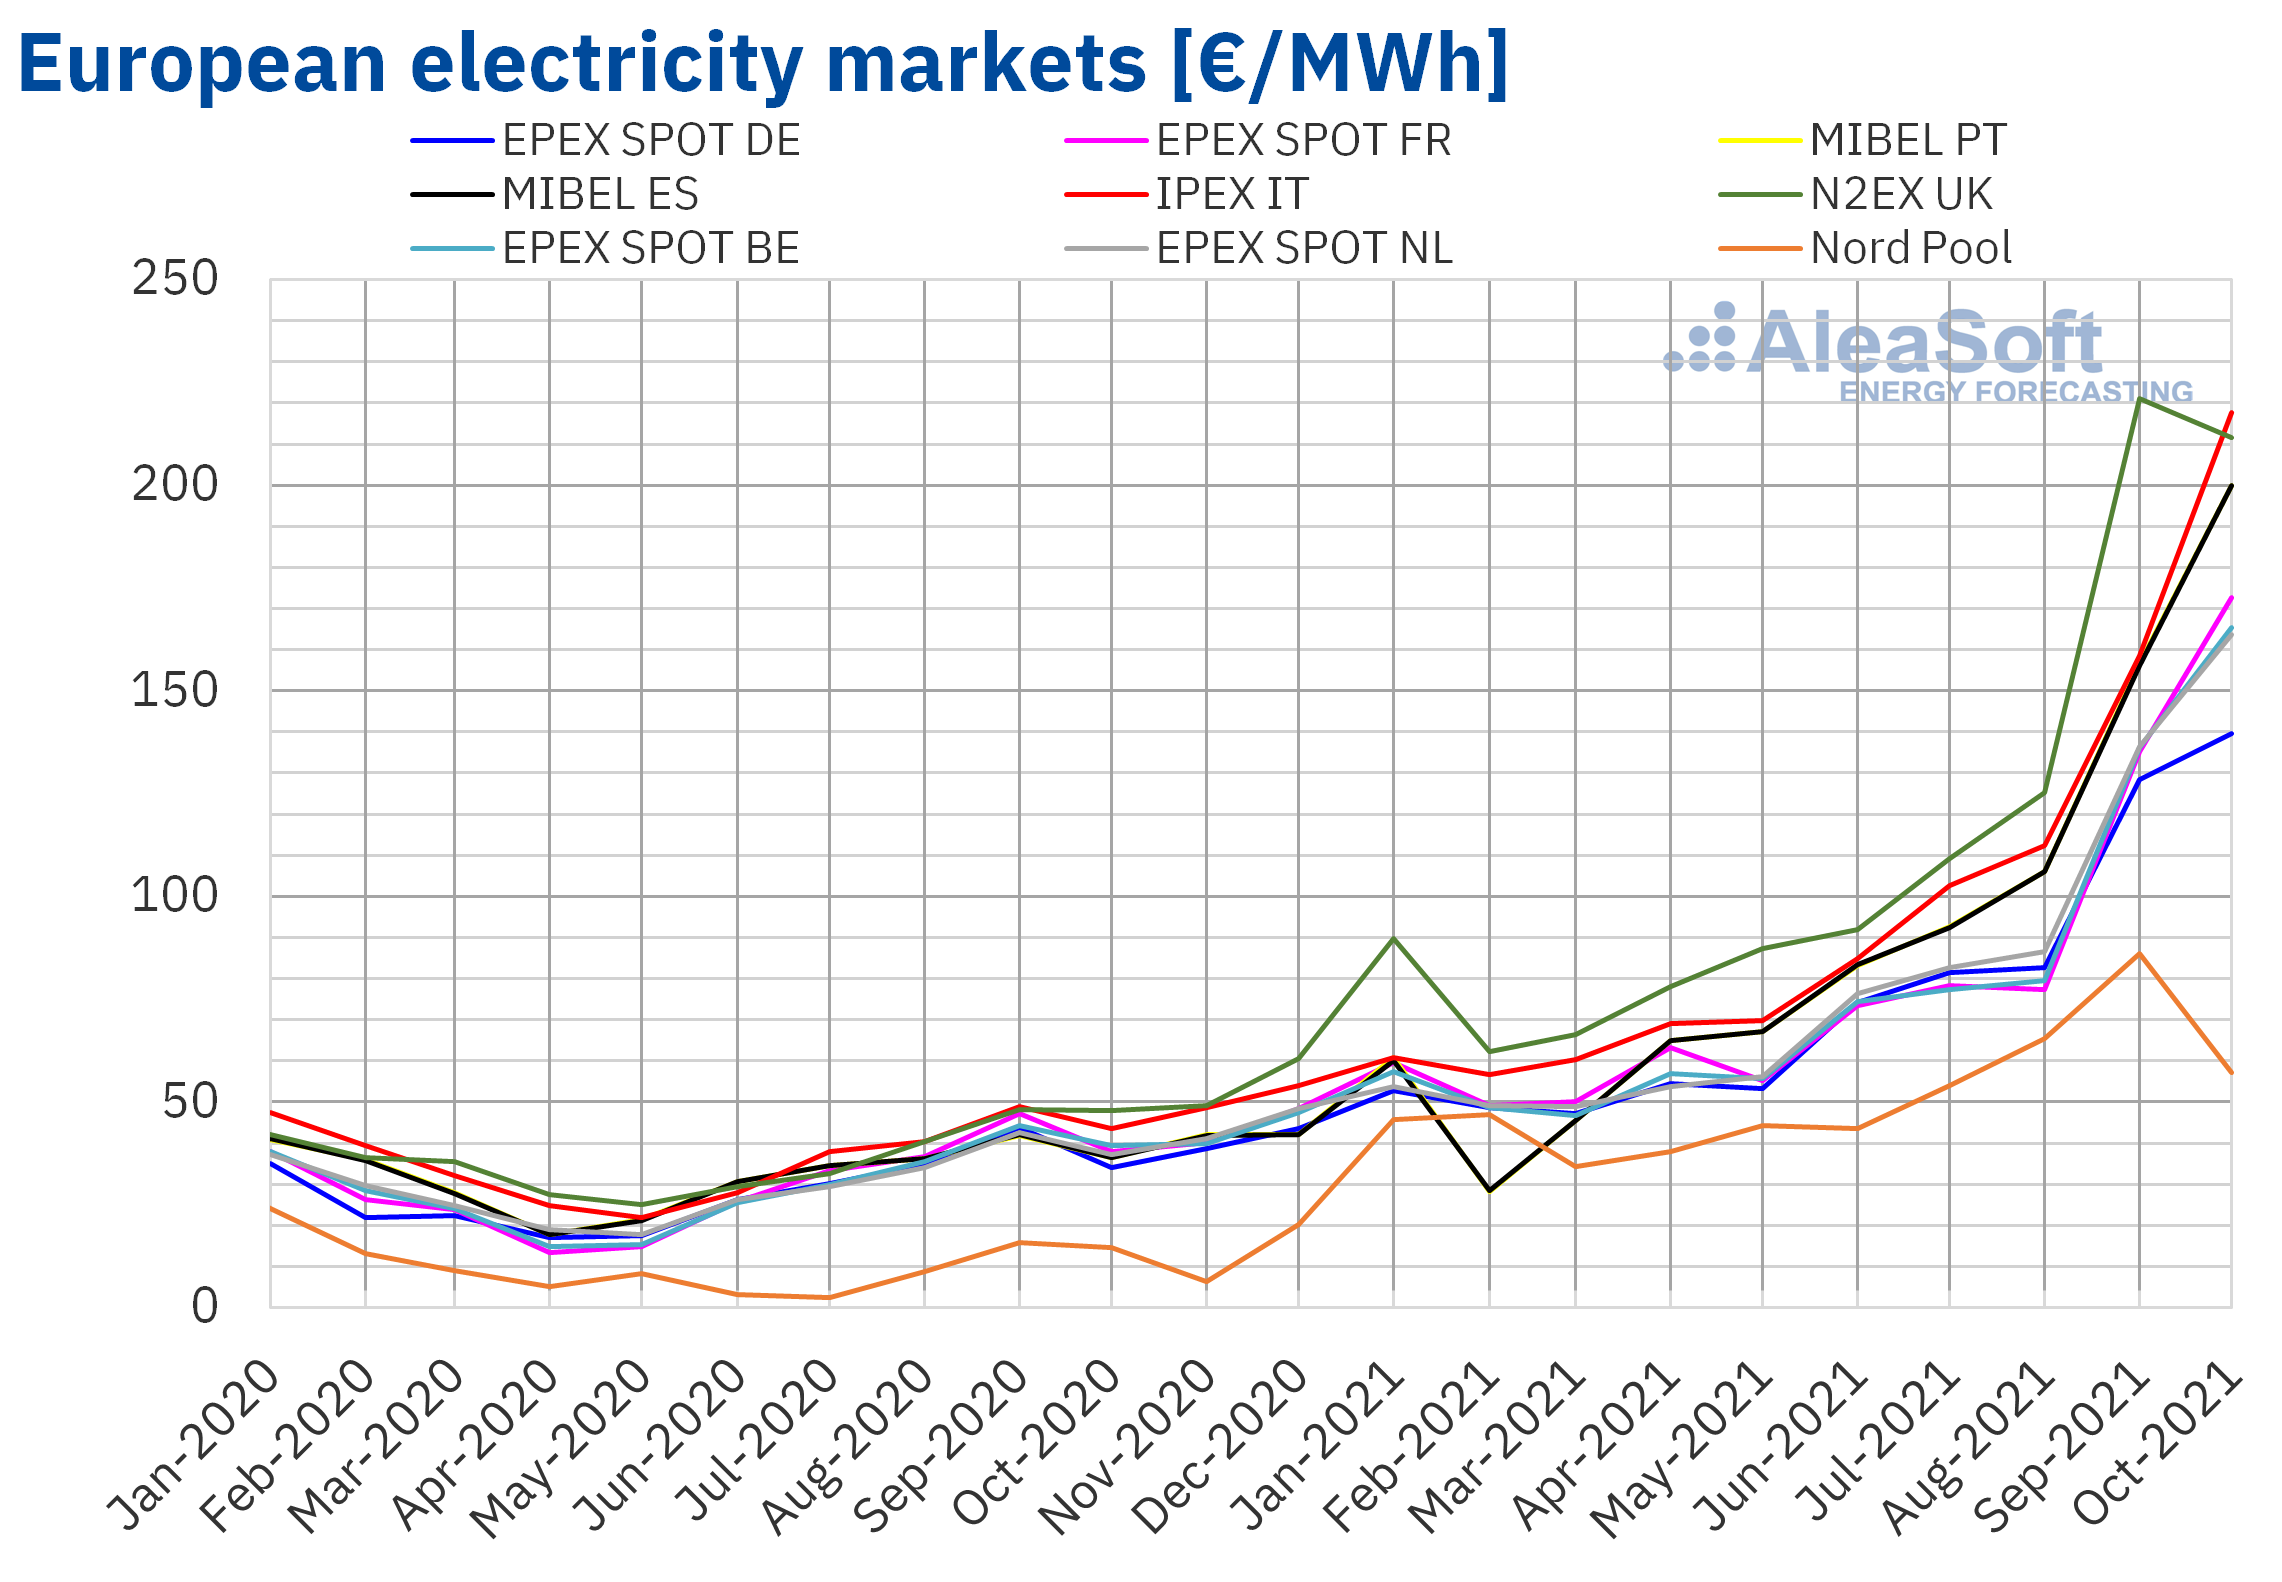
In October 2021, the monthly average price was above €135/MWh in almost all European electricity markets analysed at AleaSoft Energy Forecasting, reaching over €210/MWh in some cases. The exception was the Nord Pool market of the Nordic countries, with an average of €57.10/MWh. On the other hand, the highest monthly average price, of €217.63/MWh, was that of the IPEX market of Italy, followed by that of the N2EX market of the United Kingdom, of €211.67/MWh. In the rest of the markets, averages were between €139.49/MWh of the EPEX SPOT market of Germany and €199.92/MWh of the MIBEL market of Portugal.
Compared to September 2021, in October average prices rose in almost all European electricity markets analysed at AleaSoft Energy Forecasting. The exceptions were the Nord Pool and N2EX markets, with decreases of 34% and 4.2% respectively. On the other hand, the largest increase, of 37%, was registered in the Italian market, while the smallest increase, of 8.7%, was that of the German market. The rest of the markets had price increases between 20% of the market of the Netherlands and 28% of the markets of France, Spain and Portugal.
If average prices of the month of October are compared with those registered in the same month of 2020, prices increased significantly in all markets. The largest price increases were those of the MIBEL market of Spain and Portugal, of 447% and 449% respectively. In the rest of the markets, price increases were between 290% of the Nord Pool market and 399% of the IPEX market.
As a consequence of these increases, in October 2021, monthly prices reached historical maximum values in all analysed markets, except in the Nord Pool and N2EX markets, where prices decreased compared to those of the previous month.
On the other hand, the highest hourly prices of the month were registered on October 7 in most markets. In the case of the MIBEL market, that day the highest hourly price in its history, of €319.03/MWh, was reached. In the markets of Italy and the Netherlands, the highest prices at least since January 2005 and April 2011, respectively, were reached.
Also on October 7, the highest daily prices of the month were reached in almost all electricity markets. On that day, prices exceeded €100/MWh in all analysed markets and, in most cases, prices were close to or higher than €300/MWh. The MIBEL market, despite registering the second lowest price on that day compared to the rest of European markets, reached the highest daily price in its history, of €288.53/MWh.
However, daily prices also fell at certain times, influenced by increases in wind energy production and the evolution of gas prices. At the end of the month, the drop in gas prices contributed to a downward trend. The decline in demand over the weekend was added to this. As a consequence, on Sunday, October 31, prices of almost all European markets were below €100/MWh.
In October, the high gas and CO2 emission rights prices favoured the upward trend in European markets prices. The increase in demand in some markets also contributed to this trend. Furthermore, compared to October 2020, the wind energy production decreased in almost all markets.
 Source: Prepared by AleaSoft Energy Forecasting using data from OMIE, EPEX SPOT, Nord Pool and GME.
Electricity futures
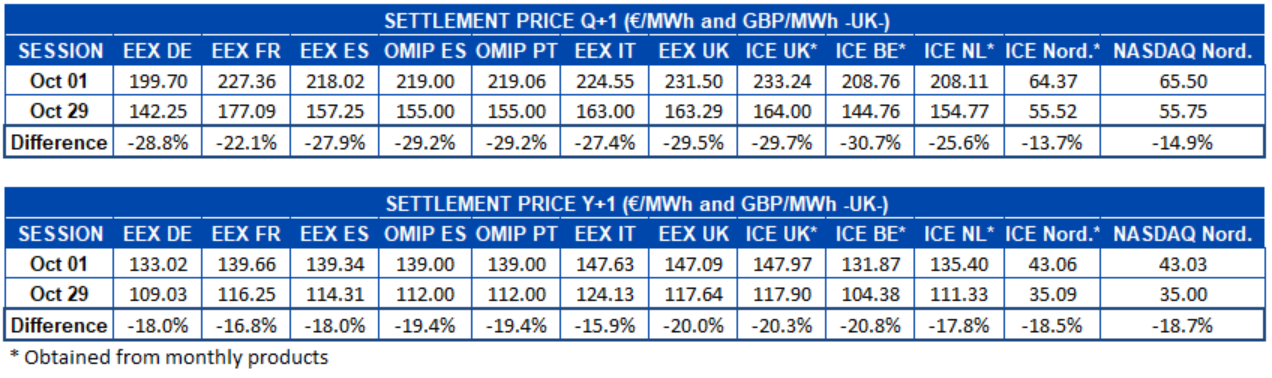
The electricity futures prices for the next quarter registered decreases between the first and the last sessions of October. The ICE market of Belgium was the one with the largest drop in its prices, with a 31% drop, although many other markets followed closely behind. Decreases of approximately 30% were registered in the OMIP market of Spain and Portugal, the EEX market of the United Kingdom, as well as in the ICE market also of the United Kingdom. The markets of the Nordic countries region were those that registered the least pronounced declines, of 14% and 15% in the ICE market and the NASDAQ market respectively. In the rest of the markets, decreases are above 22% in all cases.
In the case of the product of the next year 2022, a similar situation occurred. Between the first and last sessions of October, prices fell in all markets analysed at AleaSoft Energy Forecasting. The ICE market of Belgium was also the one with the largest decline in this case, with a drop of 21%. On the other hand, it was in the EEX market of Italy that prices registered the smallest difference between the two analysed sessions, of 16%.
Brent, fuels and CO2
Brent oil futures for the Front‑Month in the ICE market registered a monthly average price of $83.75/bbl in October. This value is 12% higher than that reached by Front‑Month futures of September 2021, of $74.88/bbl. It is also 102% higher than that corresponding to Front‑Month futures traded in October 2020, of $41.52/bbl.
In October, the recovery in demand continued to favour the increase in prices. This month, the increase in use of oil in electricity production, due to high gas prices, also contributed to the increase in demand. In addition, in October, there was a decrease in production in Nigeria and Libya.
The expectation that the previously agreed production quotas will be maintained at the next OPEC+ meeting, scheduled for November 4, may favour Brent oil futures prices increases at the beginning of November. However, the expansion of the Delta Plus variant of the coronavirus threatens the evolution of the demand.
As for the TTF gas futures prices in the ICE market for the Front‑Month, they reached the maximum settlement price of the month, of €116.02/MWh, on Tuesday, October 5. This price is the highest in at least the last eight years. On the other hand, expectations of sufficient levels of gas from Russia in winter led to the monthly minimum settlement price, of €64.86/MWh, in the last session of the month.
Regarding the average value registered during the month of October for these futures, this was €91.33/MWh, which is the highest value in history at least since October 2013. Compared with the average of Front‑Month futures traded in September 2021, of €66.20/MWh, the average increased by 38%. If compared to the Front‑Month futures traded in October 2020, when the average price was €14.18/MWh, there was a 544% rise. These price increases were favoured by low levels of gas reserves, as well as concerns about possible supply problems during the winter. Although statements about the future increase of gas from Russia stopped this trend.
As for CO2 emission rights futures in the EEX market for the reference contract of December 2021, they reached an average price of €59.48/t in October, 3.0% lower than that of September 2021, of €61.31/t. It is the first time this year that monthly prices decreased compared to those of the previous month. If compared with the average of the month of October 2020 for the reference contract of December of that year, of €25.18/t, the average of October 2021 was 136% higher.
 Source: Prepared by AleaSoft Energy Forecasting using data from ICE and EEX.
AleaSoft Energy Forecasting’s analysis on the prospects for energy markets in Europe
On November 11, the webinar “Prospects for European energy markets in the global energy crisis” will be held. The speakers from AleaSoft Energy Forecasting will be joined by speakers from Engie Spain to analyse the evolution of the energy markets in the current global energy crisis, as well as the renewable energy projects financing. In this last issue, implications and consequences of Royal Decree‑law 17/2021 and Royal Decree‑law 23/2021 in the financing conditions will be assessed.
At AleaSoft Energy Forecasting, studies and reports are being offered for hybridisation projects, mainly of solar photovoltaic energy with batteries, but also of solar photovoltaic energy with wind energy, and of the three, solar photovoltaic energy, wind energy and batteries. The objective of these studies and reports is defining strategies for optimising the operation of hybrid systems to maximise their income and estimate this income taking into account the defined strategy and the long‑term hourly price forecasting of the market.
Source: AleaSoft Energy Forecasting.
