European electricity markets panorama: Nordic countries
The wholesale electricity market of the Nordic countries, managed by Norwegian company Nord Pool, comprises seven countries with 16 market zones: six in Norway, four in Sweden, two in Denmark, one in Finland and one in each of the Baltic states of Estonia, Latvia and Lithuania.
Those seven countries represent electricity demand around 420 TWh per year, a demand volume lower than that of Germany or France but higher than Spain, Italy or the U.K. The Nord Pool is considered one of the most important electricity markets in Europe and also one of the most extensive, with interconnections to continental Europe, Russia and the former Soviet republics.
Wholesale electricity market prices
From the 16 Nord Pool market zones, the lowest prices correspond to Norway, Sweden and Denmark. The most expensive prices are in Latvia and Lithuania with Estonia and Finland midway between albeit closer to the lower priced nations.
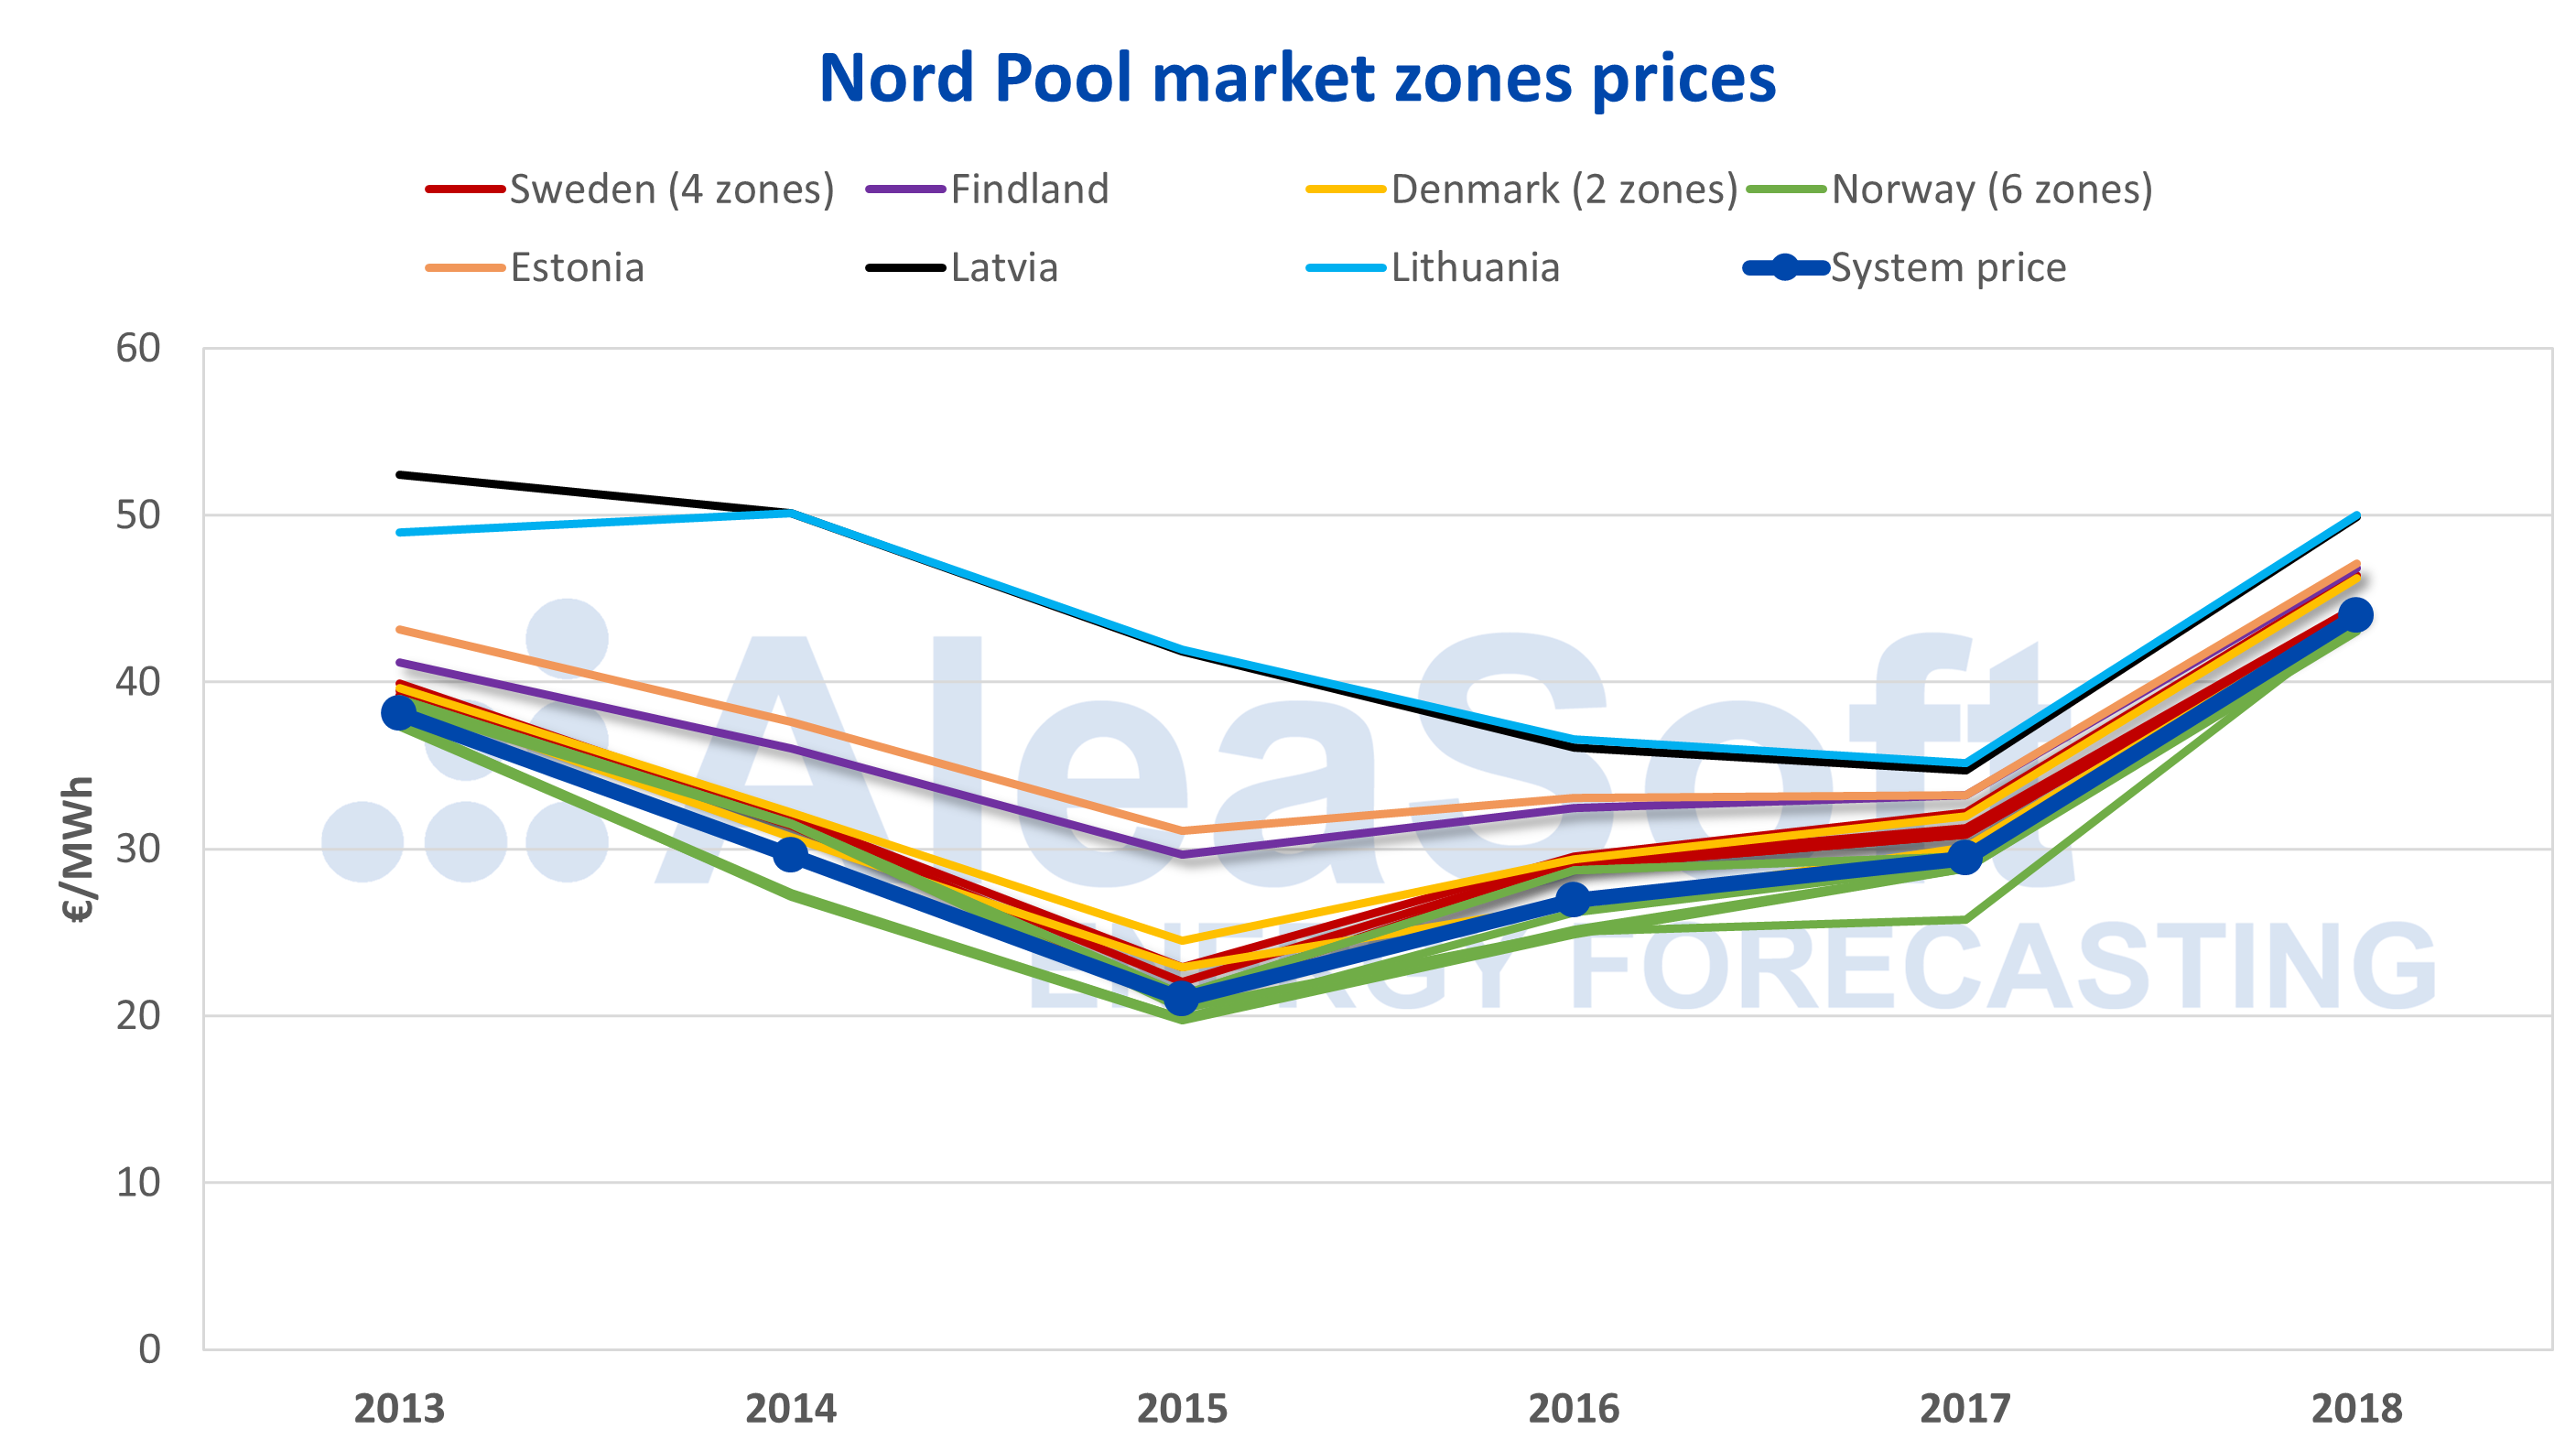
Sources: Prepared by AleaSoft using data from Nord Pool.
Since 2016, the convergence of prices between market zones has accelerated and that trend will continue as the capacity of interconnections between market zones increases. Last year the 16 zones were fully coupled and recorded exactly the same price for 1,703 hours – 20% of the time. This phenomenon of total coupling in the Nord Pool took place in only 9.3% of the hours of 2017 and 4.3% in 2016.
The Nord Pool also calculates a “system price” that represents the price that would be obtained for every hour if there were no limitations in the capacity of the interconnections. That is, if the capacity of interconnection between the market zones were infinite. In 2018, the average system price was €43.99/MWh, 50% higher than in 2017 and 63% higher than in 2016. This price increase is correlated with similar increases in the rest of the European electricity markets and increases in the price of fuels (63% increase in the price of TTF gas and 53% of the price of API 2 coal since 2016) and the price of CO2 emission rights, which tripled in the last two years.
Even benefiting from an extraordinary amount of renewable energy in its electricity generation mix, it can be observed the Nordic countries are not insensitive to the price fluctuations of gas and coal, or of CO2 emission rights. This is due to the fact that most of its renewable production is hydroelectric, a dispatchable source whose market opportunity price depends, among other factors, on the price the thermal technology market offers, whether from Nordic market zones or from countries such as Germany through electricity imports.
Negative prices are not unusual in the Nord Pool although in recent years they have only occurred in the two market zones of Denmark, with an extreme value of €-200/MWh in 2012. In 2018, the minimum hourly price was €-15/MWh. Given the low volume of the two zones in the Nord Pool, these negative prices do not appear in the price of the system, which in 2018 had a minimum hourly price of €2.17/MWh.
Compared with other European markets, the Nordic electricity market has historically been the lowest priced in Europe, competing for that honor with the German market and clearly emerging as the winner during the last decade.
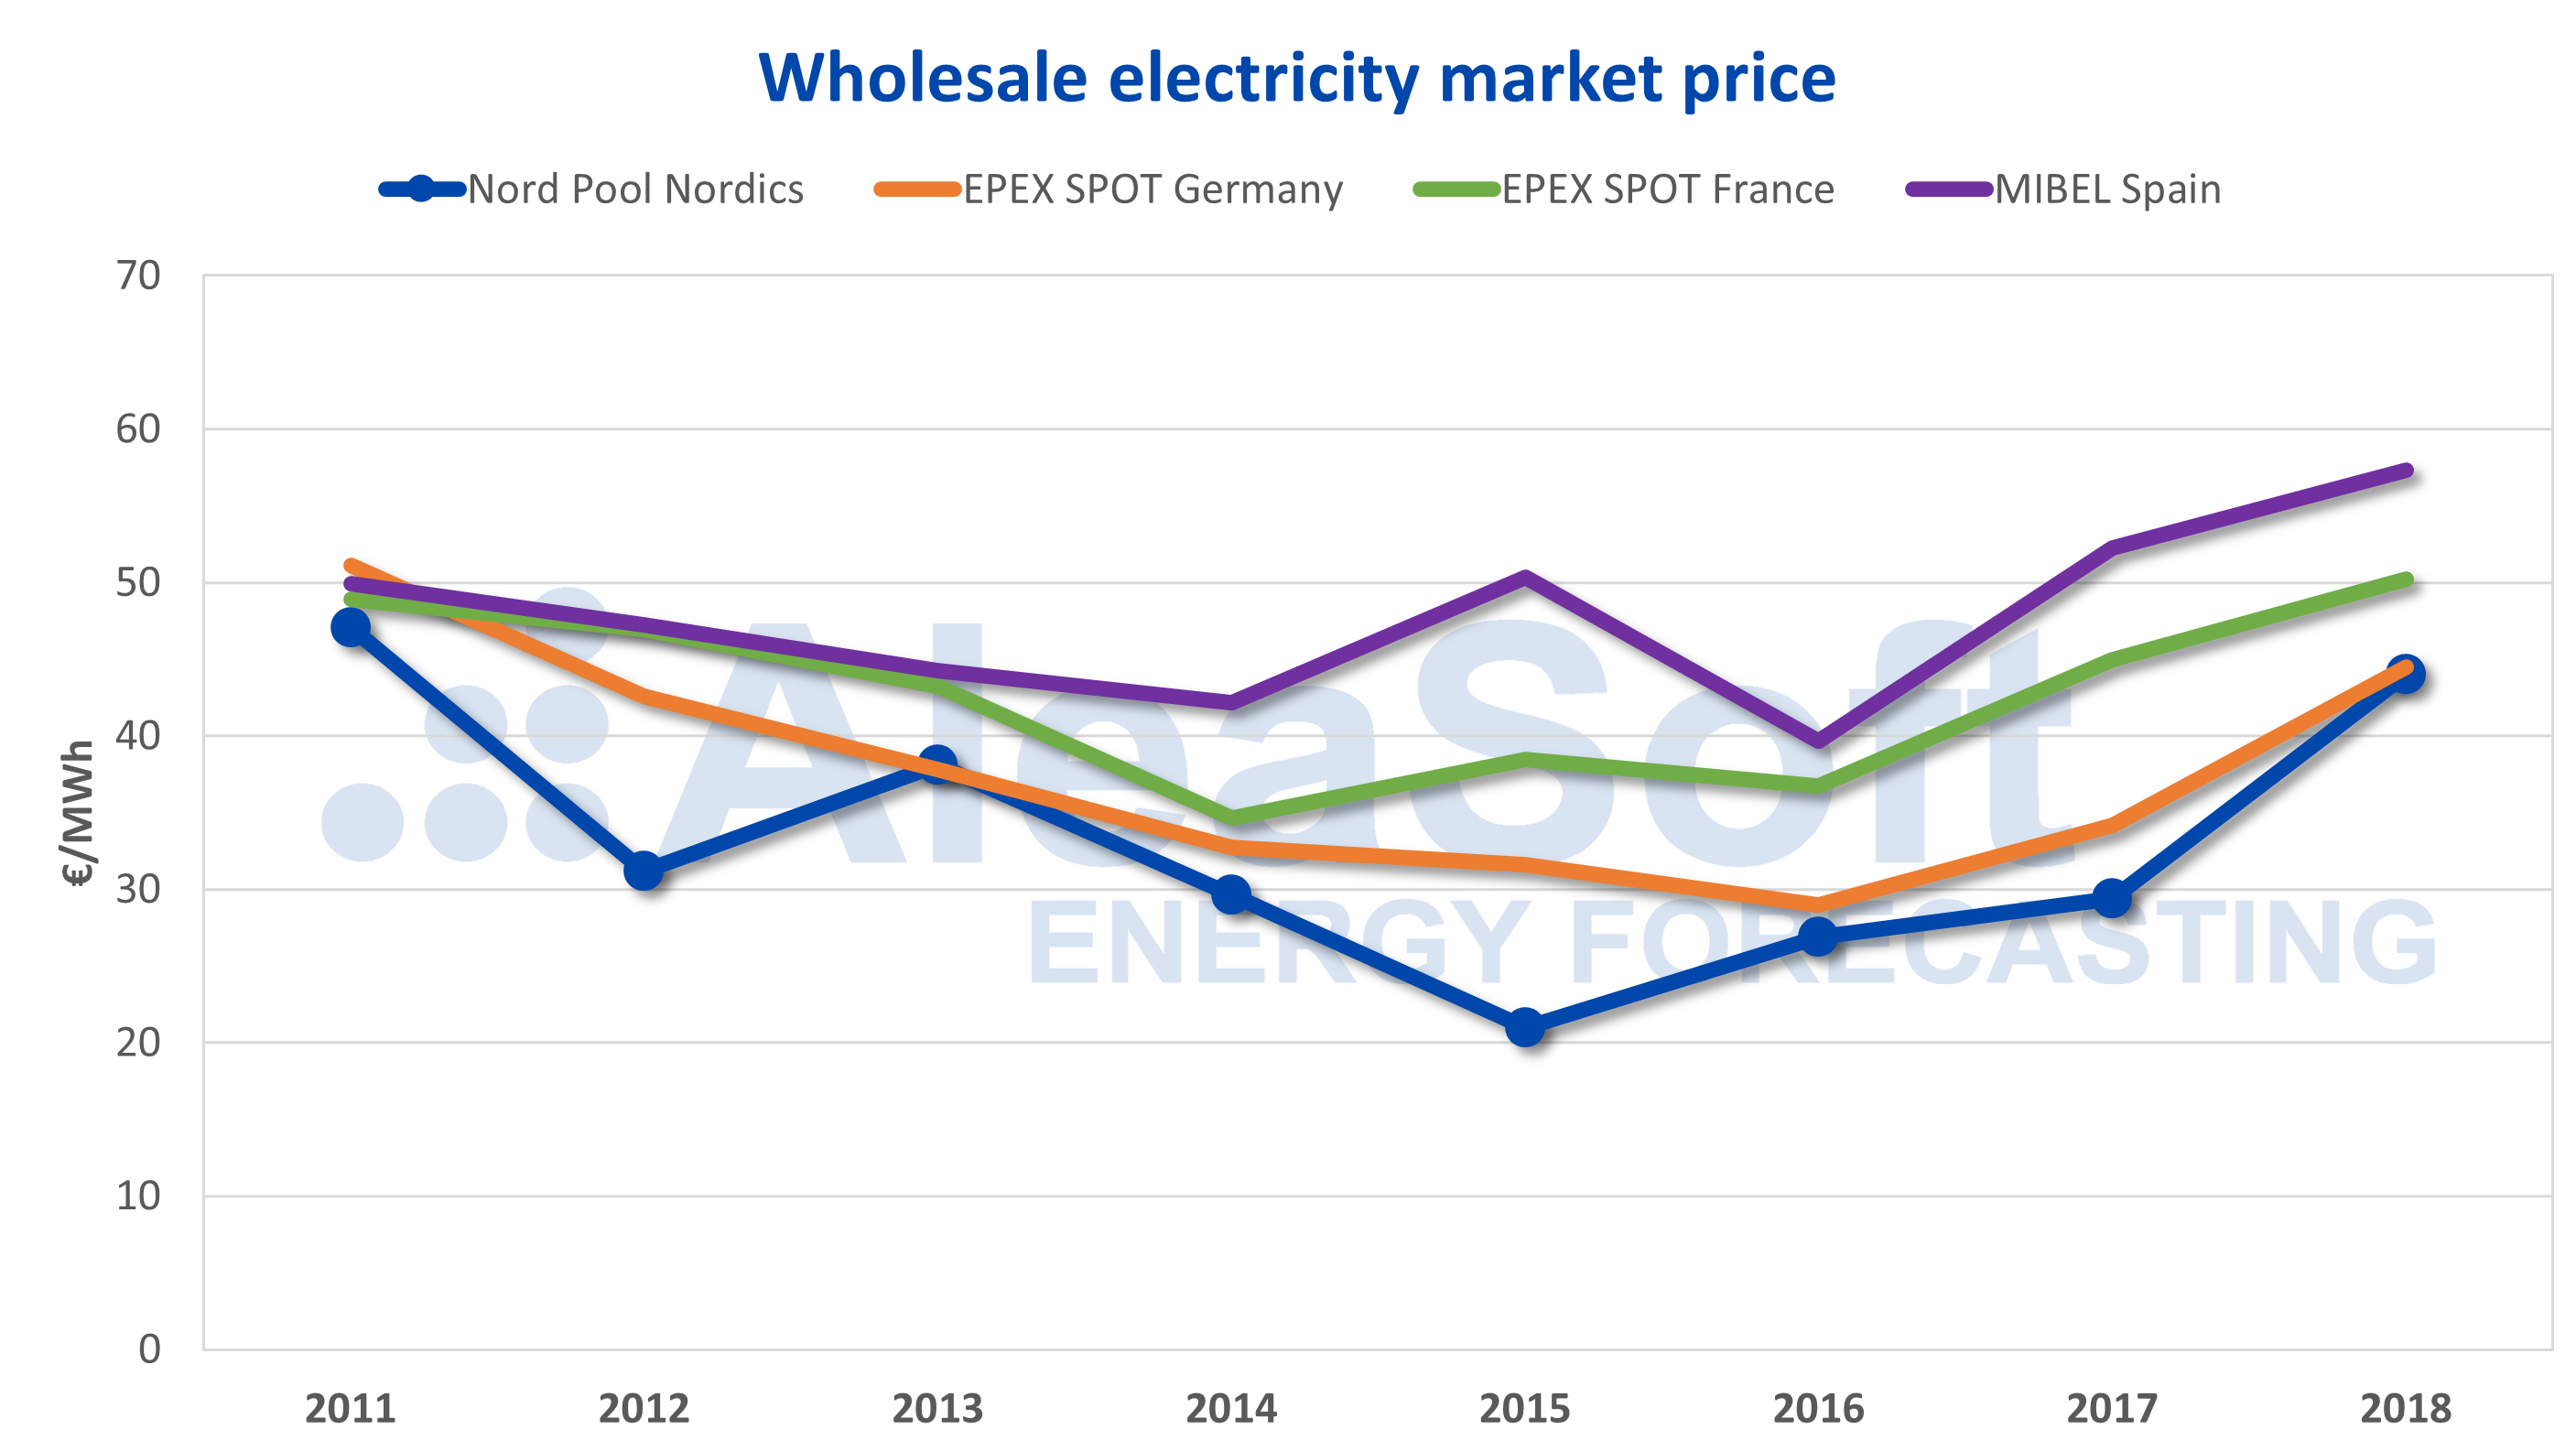
Source: Prepared by AleaSoft using data from Nord Pool, EPEX SPOT and OMIE.
Installed capacity
Hydroelectric power clearly dominates electricity generation capacity in the Nordic countries, with 45% of total installed capacity. Most of the hydroelectric potential is in Norway and Sweden, with 29 GW and 16 GW, respectively, although it also represents a significant proportion of the production fleet in Finland (3 GW – 18% of the country’s total capacity), Latvia (1.5 GW, 54%) and Lithuania (1 GW, 29%).
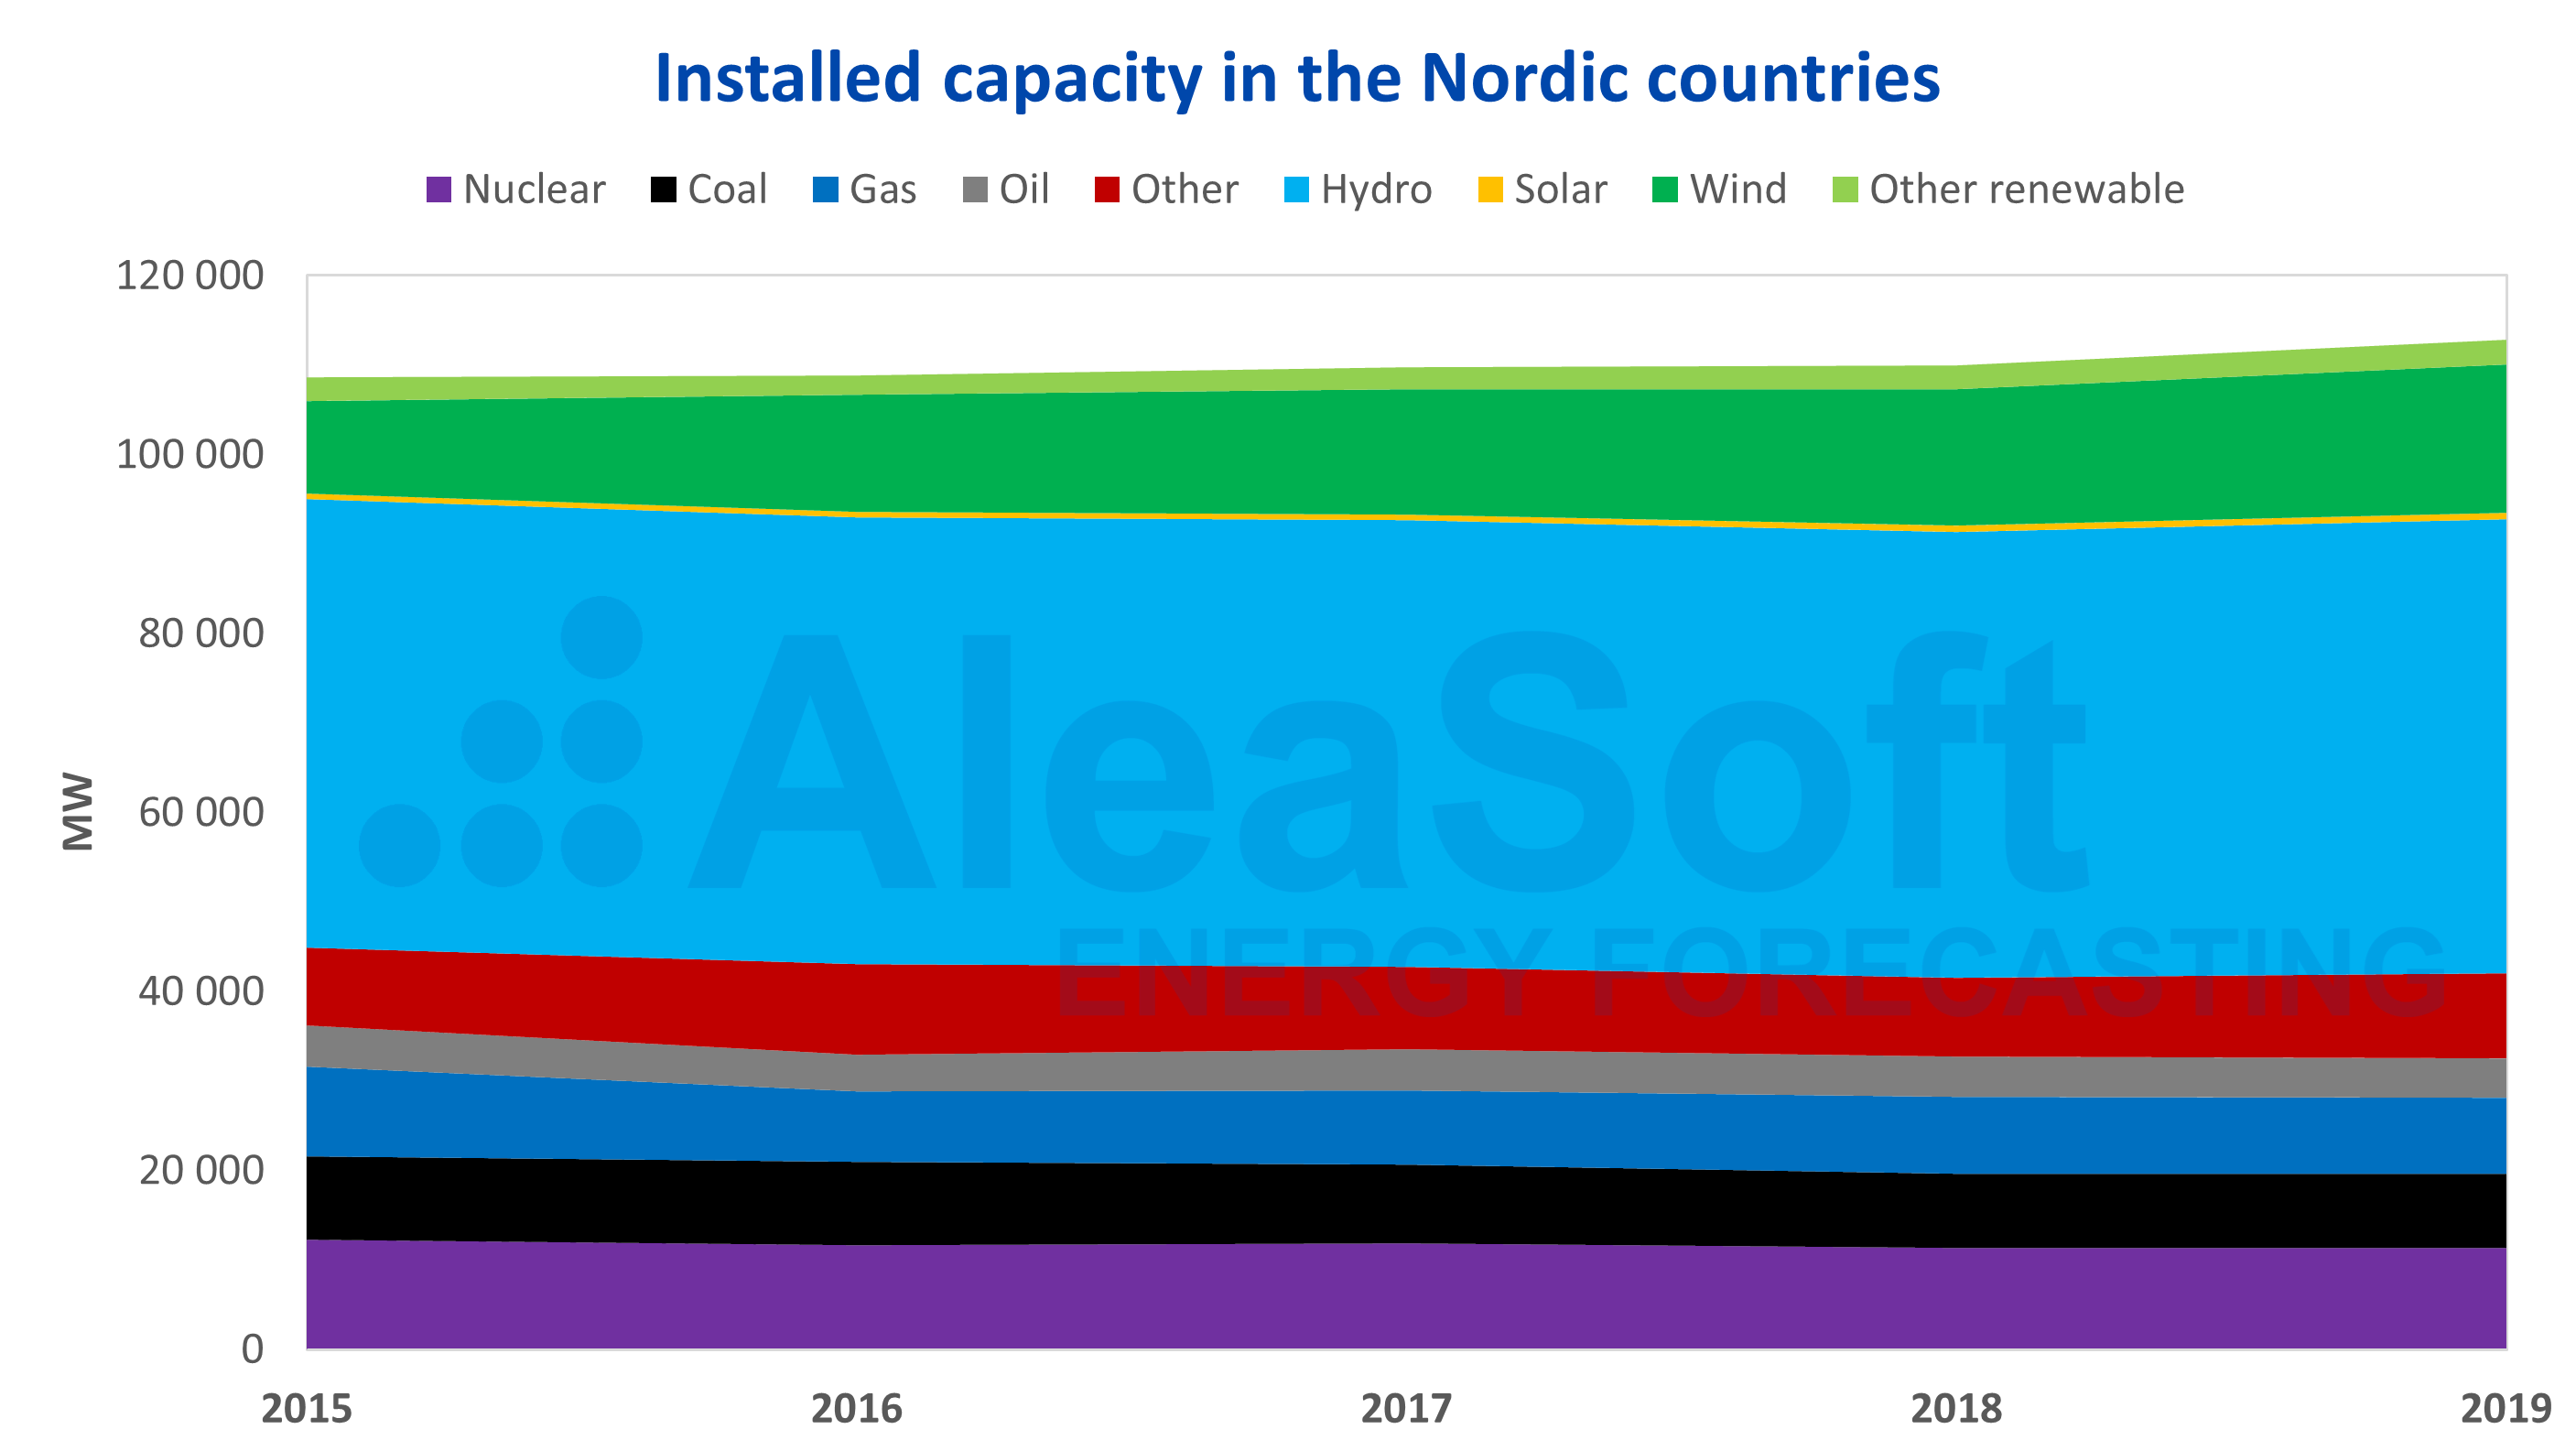
Source: Prepared by AleaSoft using data from ENTSO-E.
Wind power follows, with 15% of the total generation capacity of the market. Wind farms are mainly in Sweden, with 7.5 GW to make up 18% of the country’s power, and Denmark, with 4.8 GW and 32%.
The rest of the renewable technologies are already less present in Nordic countries. Solar power, with 700 MW, represents 0.6% of the total Nordic fleet and is concentrated almost entirely in Denmark, and the remaining renewables make up 2.4% of total installed power.
Nuclear energy is placed as third technology in the Nord Pool countries in terms of installed capacity, behind hydroelectric and wind power. Only two of the seven countries have nuclear reactors: Sweden, with 8.6 GW for nuclear to represent 21% of the country’s total capacity, and Finland, with 2.8 GW and 16%.
Renewables and nuclear – technologies without CO2 emissions – represent 73% of the total generation capacity of Nordic countries.
The thermal technologies that produce electricity with gas, coal and fuel-oil represent 19% of the electricity generation fleet. The distribution of thermal capacity among the different countries differs markedly. While Sweden and Norway have zero or very little thermal capacity, in the rest of the Nordic countries these technologies represent an important contributor. For example, in Estonia thermal power represents 76% of total capacity; in Denmark, 59%; in Lithuania, 48%; and in Finland and Latvia, 39%.
Generation mix
As for the electricity produced by each technology, it is not surprising that the vast majority – 53% last year – came from hydro. In second place was nuclear, which exceeded the production of wind power despite having less installed capacity. In 2018, nuclear energy production accounted for 21% of the Nordic electricity generated, compared to 9.8% for wind.
Renewable energy technologies accounted for 62% of total output in 2018. Adding nuclear, the value was 84%. This generation is zero or very low in CO2 emissions, which places Nordic countries in a privileged position when it comes to elimination of greenhouse gas emissions in electricity generation.
The historically low prices of the Nord Pool market are related to this large part of production from renewables and nuclear, technologies with low variable and opportunity costs.
Thermal production with gas, coal and fuel-oil, meanwhile, stood at 8.8% in 2018.

Source: Prepared by AleaSoft using data from ENTSOE-E, IEA, Svenska Kraftnät, Statnett, Fingrid, Energinet, Litgrid, Elering and AST.
In addition to the electricity exchanges between the countries of the Nord Pool market, there are also interconnections with Russia, the Netherlands, Poland, Belarus and Germany. During the last six years, the exchange balance with Russia has always been as an importer, with 11.7 TWh net imported in 2018. The second most important exchange balance has been with the Netherlands, this time in the opposite direction, with a balance of 3.7 TWh exported in 2018. The balance with Poland has tended to grow in recent years and since 2007 the net balance is exporting, with 3.6 TWh exported last year.

Source: Prepared by AleaSoft using data from Nord Pool, ENTSOE-E, Svenska Kraftnät, Statnett, Fingrid, Energinet, Litgrid, Elering and AST.
The future of nuclear energy and renewable energy
As we have seen, the emissions level from electricity generation in the Nord Pool countries is very low thanks to renewable energy – practically all hydroelectric – and nuclear. To further reduce emissions, all Nord Pool countries are betting to a greater or lesser extent on the increase of renewable capacity and the reduction of electricity production from fossil fuels, especially coal and fuel-oil.
With regard to the star technology right now – hydro – only Norway has plans to increase its capacity significantly. In terms of growth, wind power is in practically all the energy and climate plans of Nordic nations as an important bet for the increase of renewable capacity. And, although it might seem solar technology has little margin in such extreme latitudes, the increase in production with this technology is expected to be very important in the Nord Pool nations. Although solar will not reach the production levels of hydro or wind power, in the long term it could cover up to 5% of electricity demand.
As for fossil fuels, there is a clear intention to reduce energy production from coal in Sweden, Finland and Denmark; the countries that use this fuel the most. But its complete elimination is not predicted any time soon. The desire to reduce fuel-oil generation in its main Nordic market of Estonia is also very clear but total eradication is not expected in the short or medium term.
Finally there is the dilemma of nuclear: it does not emit CO2 but requires management of toxic waste. The two countries with nuclear reactors have different outlooks. Finland plans to almost double its nuclear capacity. Sweden plans to phase out all its nuclear power stations, starting in the next few years, but with a final push from 2035 to have all nuclear plants shut by 2050.
All this while it is expected electricity demand will increase, although at a very low rate of around 0.5% per year in the long term. It should also be borne in mind 13 projects are planned to increase the interconnection capacity of the Nord Pool countries with third-parties in the next 15 years, a move which could increase capacity by more than 10 GW.