When the rivers stop flowing: Europe’s drought summer measured
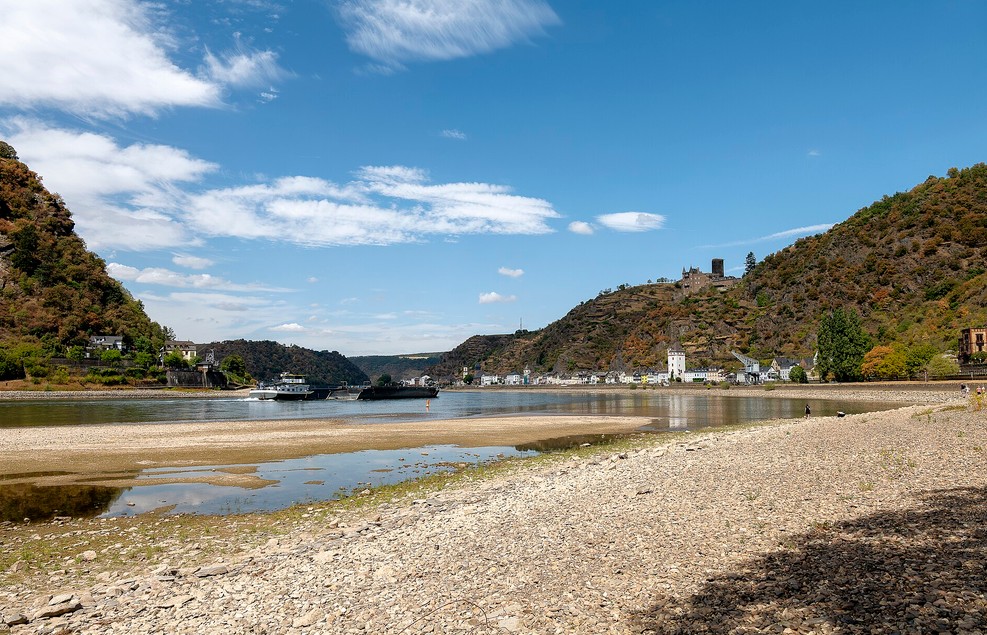
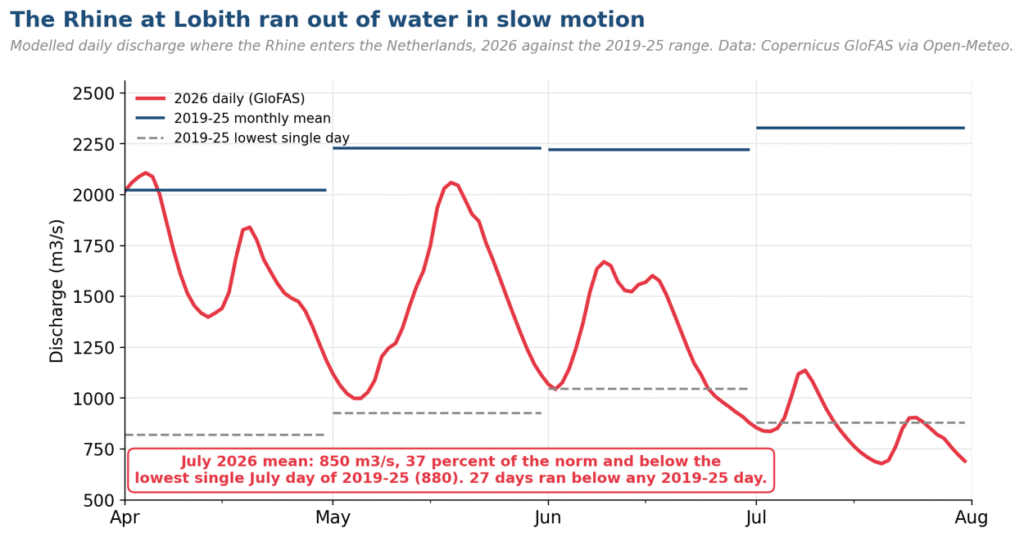
The hydrology deteriorated in slow motion. Modelled daily discharge, the volume of water flowing past a fixed point, for the Rhine at Lobith, where the river enters the Netherlands, averaged 81% of its 2019 to 25 norm in April, 66% in May, 58% in June and 37% in July. Twenty-seven days in 2026 fell below the lowest single day recorded at that station in the previous seven Aprils to Julys, a period that includes the drought of 2022. The July figure deserves a second look: the 2026 monthly average of 850 m3/s sits below the lowest single July day of the entire 2019 to 25 baseline, 880 m3/s, recorded in the drought summer of 2022. An average month in 2026 was worse than the worst day of the previous seven years.
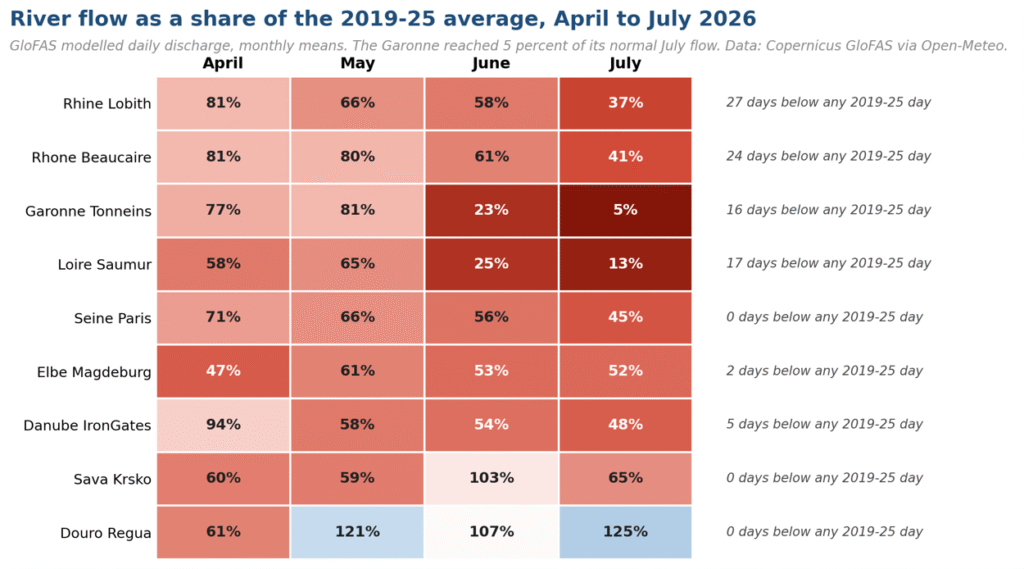
France ran dry from the south. The Garonne at Tonneins averaged 5% of its normal July flow, with sixteen days below anything seen in 2019 to 25. The Loire at Saumur reached 13% of normal in July and the Rhone at Beaucaire 41%. On the Danube the squeeze built downstream: flow through the Iron Gates, the river’s largest hydro complex, ran at 58% of normal in May, 54% in June and 48% in July, and five July days ran below anything in the station’s 2019 to 25 record.
Hydro: losses in the drought corridor, gains in Iberia
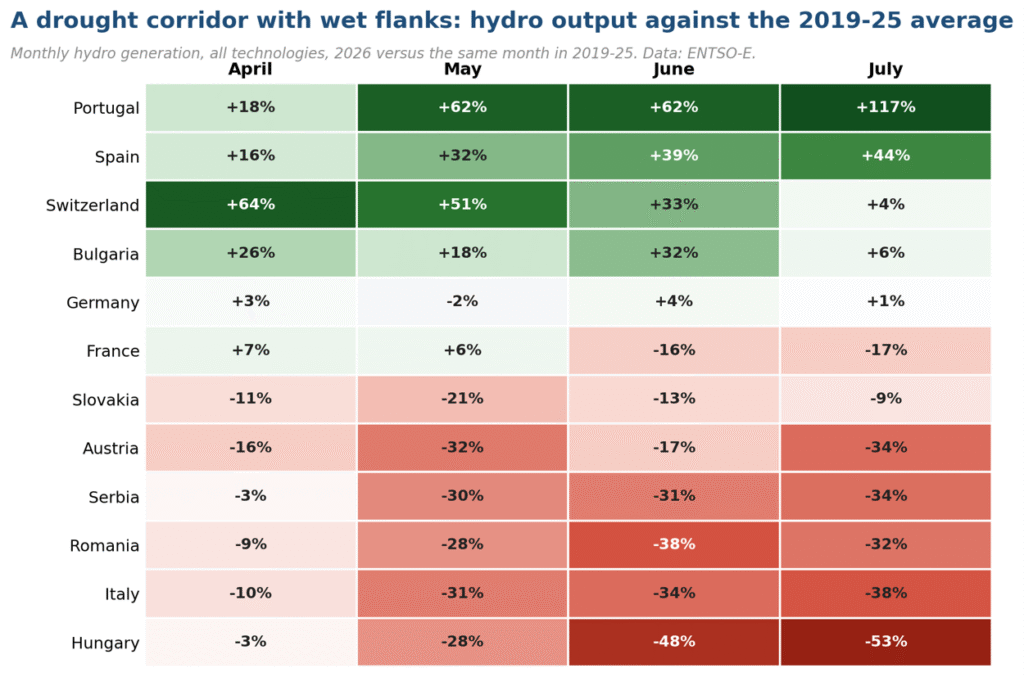
Generation patterns closely tracked river conditions. The seven corridor systems, Austria, Italy, Romania, Serbia, Hungary, Slovakia and France taken together, produced roughly 13 TWh less hydro between April and July than the 2019 to 25 average for the same months, a shortfall of one fifth. Austria was down 34% in July, Italy 38%, Serbia 34%, Romania 32% and Hungary 53%. France flipped from a wet spring, 6% to 7% above normal in April and May, to 16% and 17% below in June and July. The correlation data confirms how direct the link is: daily Serbian run-of-river output, from plants that generate directly on the current without a storage dam, tracked Iron Gates flow with a correlation of 0.89, and French run-of-river tracked the Rhone at 0.73. Run-of-river generation moved closely with changing river conditions.
Several neighboring systems experienced considerably stronger hydrological conditions. Portuguese hydro ran 117% above its norm in July after a rain-heavy first half, Spain finished the window 16% to 44% above normal by month, and Swiss output opened 64% above norm in April on strong melt before converging to 5% above by July as the snow reserve ran out. Together the wet flanks added roughly 9 TWh against the baseline, offsetting about 70% of the corridor’s loss at continental level, but not in the places that needed it. Reservoir data sharpens the picture for the autumn: by mid-July, Italian and Romanian storage stood closer to the 2015 to 25 minimum than to the median, Spanish reservoirs sat near the top of their historical band, and Portuguese storage held above its median.
Nuclear on a warm, shallow river
The Danube plants illustrate the most acute impacts observed in late July. At Cernavoda in Romania, both units were offline on nineteen May days during the spring outage season. One unit carried June alone at around 15 GWh per day, the second returned in early July and lifted output to around 26, and over the final three days of the month output fell back to 15 GWh per day against a July norm near 29, at the bottom of a month in which Danube flow through the Iron Gates averaged 48% of normal. In Hungary, Paks fell from 38 GWh per day on July 28 to 21 on July 31, a cut of 45% in three days and its lowest level of the entire window. Bulgarian nuclear output had already run 22% below its June norm. The instructive detail sits in the temperature series: riverside air at Paks exceeded 32 C on only six July days. The observed output reductions coincided more closely with river conditions than with periods of extreme air temperature.
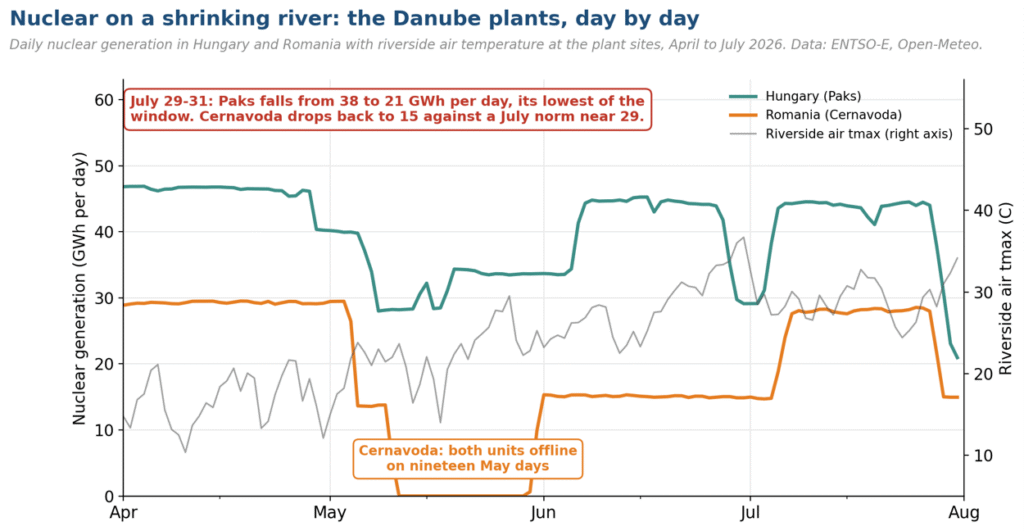
France showed the other face of the same exposure, and the national data keeps the two forces in proportion. Riverside air at the Golfech site on the Garonne reached 35 C or more on ten July days, and the Garonne itself carried 5% of its normal July flow. Yet French fleet output ran 10% to 15% above its 2019 to 25 norm in every month of the window, and the summer’s lowest single days, 792 GWh in late June and 831 GWh on July 12, remained shallow against a fleet averaging roughly 945 GWh per day. Whatever heat management individual river-cooled units required, it stayed episodic and site-specific in the aggregate series. The Danube plants showed a markedly different pattern from that observed in France: river conditions that coincided with substantial output reductions. Switzerland sat in between. National nuclear output ran 12% to 23% below norm in April and May, a period in which the public series cannot separate maintenance schedules from river conditions, and daily output fell 16% over the final four days of July.
Coal, barges and the Rhine question
Low water on the Rhine constrains barge loading and raises fuel logistics costs on the corridor before it removes megawatt-hours. In the generation data, German coal output showed no clean flow signal: its correlation with Kaub discharge across the window was 0.20, and monthly coal output moved with wind conditions rather than with the river. The pattern is consistent with plants drawing on fuel stocks and rail alternatives, so that the constraint surfaced first as cost rather than as lost output. Serbia was the exception in the coal data, cutting lignite-fired generation by roughly 0.7 TWh against 2025 while raising imports, concentrated in the hottest weeks of the window.
How systems compensated for reduced hydro output, and at what price
Each system balanced the shortfall differently. Italy replaced 3.6 TWh of lost hydro, measured against 2025, with 4.1 TWh of additional gas-fired generation, plus 1.1 TWh of new solar. Austria covered a 2.4 TWh hydro shortfall mainly with electricity imports, measured here as the gap between national consumption and generation and 1.6 TWh higher than a year earlier, and 0.9 TWh of added solar. Switzerland combined 1.4 TWh of additional net imports with nuclear output 0.5 TWh higher than a year earlier. Serbia substituted imports for both water and coal. Romania experienced one of the more constrained adjustment paths: national consumption ran roughly 1.2 TWh below 2025 across the window, in a period of surging regional prices and constrained domestic units. Solar provided positive year-on-year generation growth across all reporting corridor markets, adding output year on year in every corridor market that reports it to ENTSO-E, from 0.3 TWh in Hungary to 0.9 TWh in Austria and 1.1 TWh in Italy, alongside 5.4 TWh in Spain.
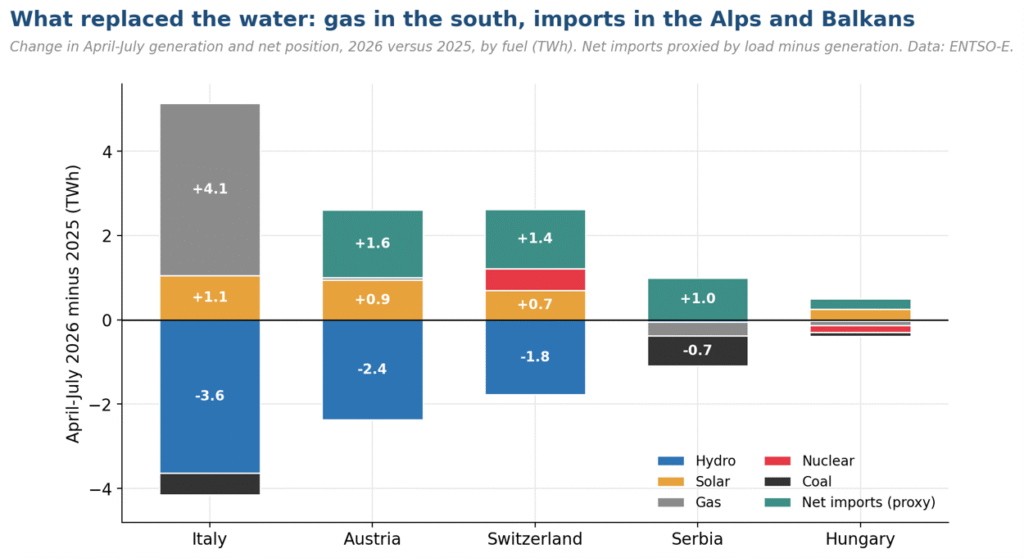
Nuclear and hydro are among the technologies that power systems typically rely on for sustained output. This summer, both showed varying degrees of exposure to water availability in several drought-affected regions. Strong production in a normal year does not necessarily indicate how a system will perform during periods of extreme water stress. Along drought-affected sections of the corridor, hydro losses coincided with reductions at selected river-cooled nuclear stations. The observed response relied on imports, additional gas-fired generation and solar output, which together offset part of the shortfall.
Interconnection moved Alpine and Balkan deficits to better-supplied neighbors, gas-fired generation increased significantly in Italy, and solar added output across the corridor, the one major generation source in this analysis whose output was not directly constrained by river availability. No single technology offset the loss alone, but the combination of generation sources and cross-border imports absorbed simultaneous reductions in hydro output and output constraints at selected river-cooled nuclear stations.
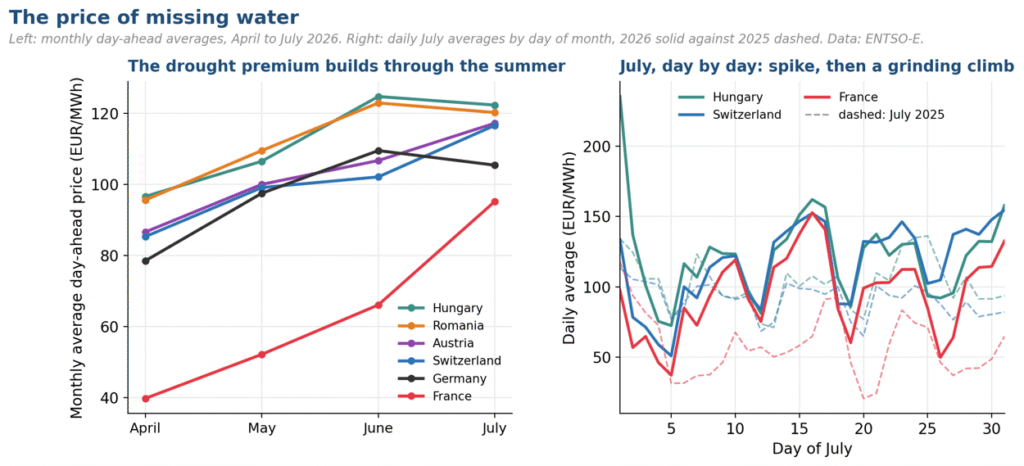
The market impact of replacing lost hydro generation intensified through the summer. In the day-ahead market, the wholesale reference price set one day before delivery, July averages reached €122 ($140.9)/MWh in Hungary against €103 a year earlier, €120 in Romania, €117 in Austria against €88, and €117 in Switzerland against €91. France averaged €95/MWh against €58 in July 2025. The daily pattern shows two distinct shocks: a heat-demand spike that pushed Hungarian, Romanian and Serbian daily averages above €225/MWh on July 1, and then a grinding climb through late July as rivers emptied, with Swiss daily prices averaging €134/MWh over July 22 to 31. The price impact associated with drought conditions appeared persistent rather than short-lived, because recovery in river conditions typically occurs more slowly than short-lived weather events.
How WSP’s Electricity Market Outlook can help
Do you need to know how a hydro portfolio, a river-cooled plant or a cross-border position performs in a repeat of this summer, or in a drier one? These are the types of questions assessed using WSP’s Electricity Market Outlook (EMO). The underlying model, PRIMES-IEM, sits behind two decades of European Commission policy analysis. It runs all European markets simultaneously to 2050, with cross-border flows derived by replicating the EUPHEMIA algorithm used by ENTSO-E. Outputs cover hourly prices, capture rates, hydro and cooling-water sensitivity scenarios, curtailment exposure and BESS profitability projections at country and asset level, the quantitative inputs commonly used in PPA structuring, adequacy assessment and project-finance analysis.
Author: Safa Sen, Market Engagement Lead for CWE at WSP
WSP is one of the world’s leading professional services firms, uniting engineering, advisory and science-based expertise to shape communities and advance humanity. From local beginnings to a globe-spanning presence today, it operates in over 50 countries and delivers innovative projects across sectors: Transport & Infrastructure, Property & Buildings, Earth & Environment, Water, Power & Energy and Mining & Metals.
The views and opinions expressed in this article are the author’s own, and do not necessarily reflect those held by pv magazine.
This content is protected by copyright and may not be reused. If you want to cooperate with us and would like to reuse some of our content, please contact: [email protected].
Please login to comment