The summer solar carried the water
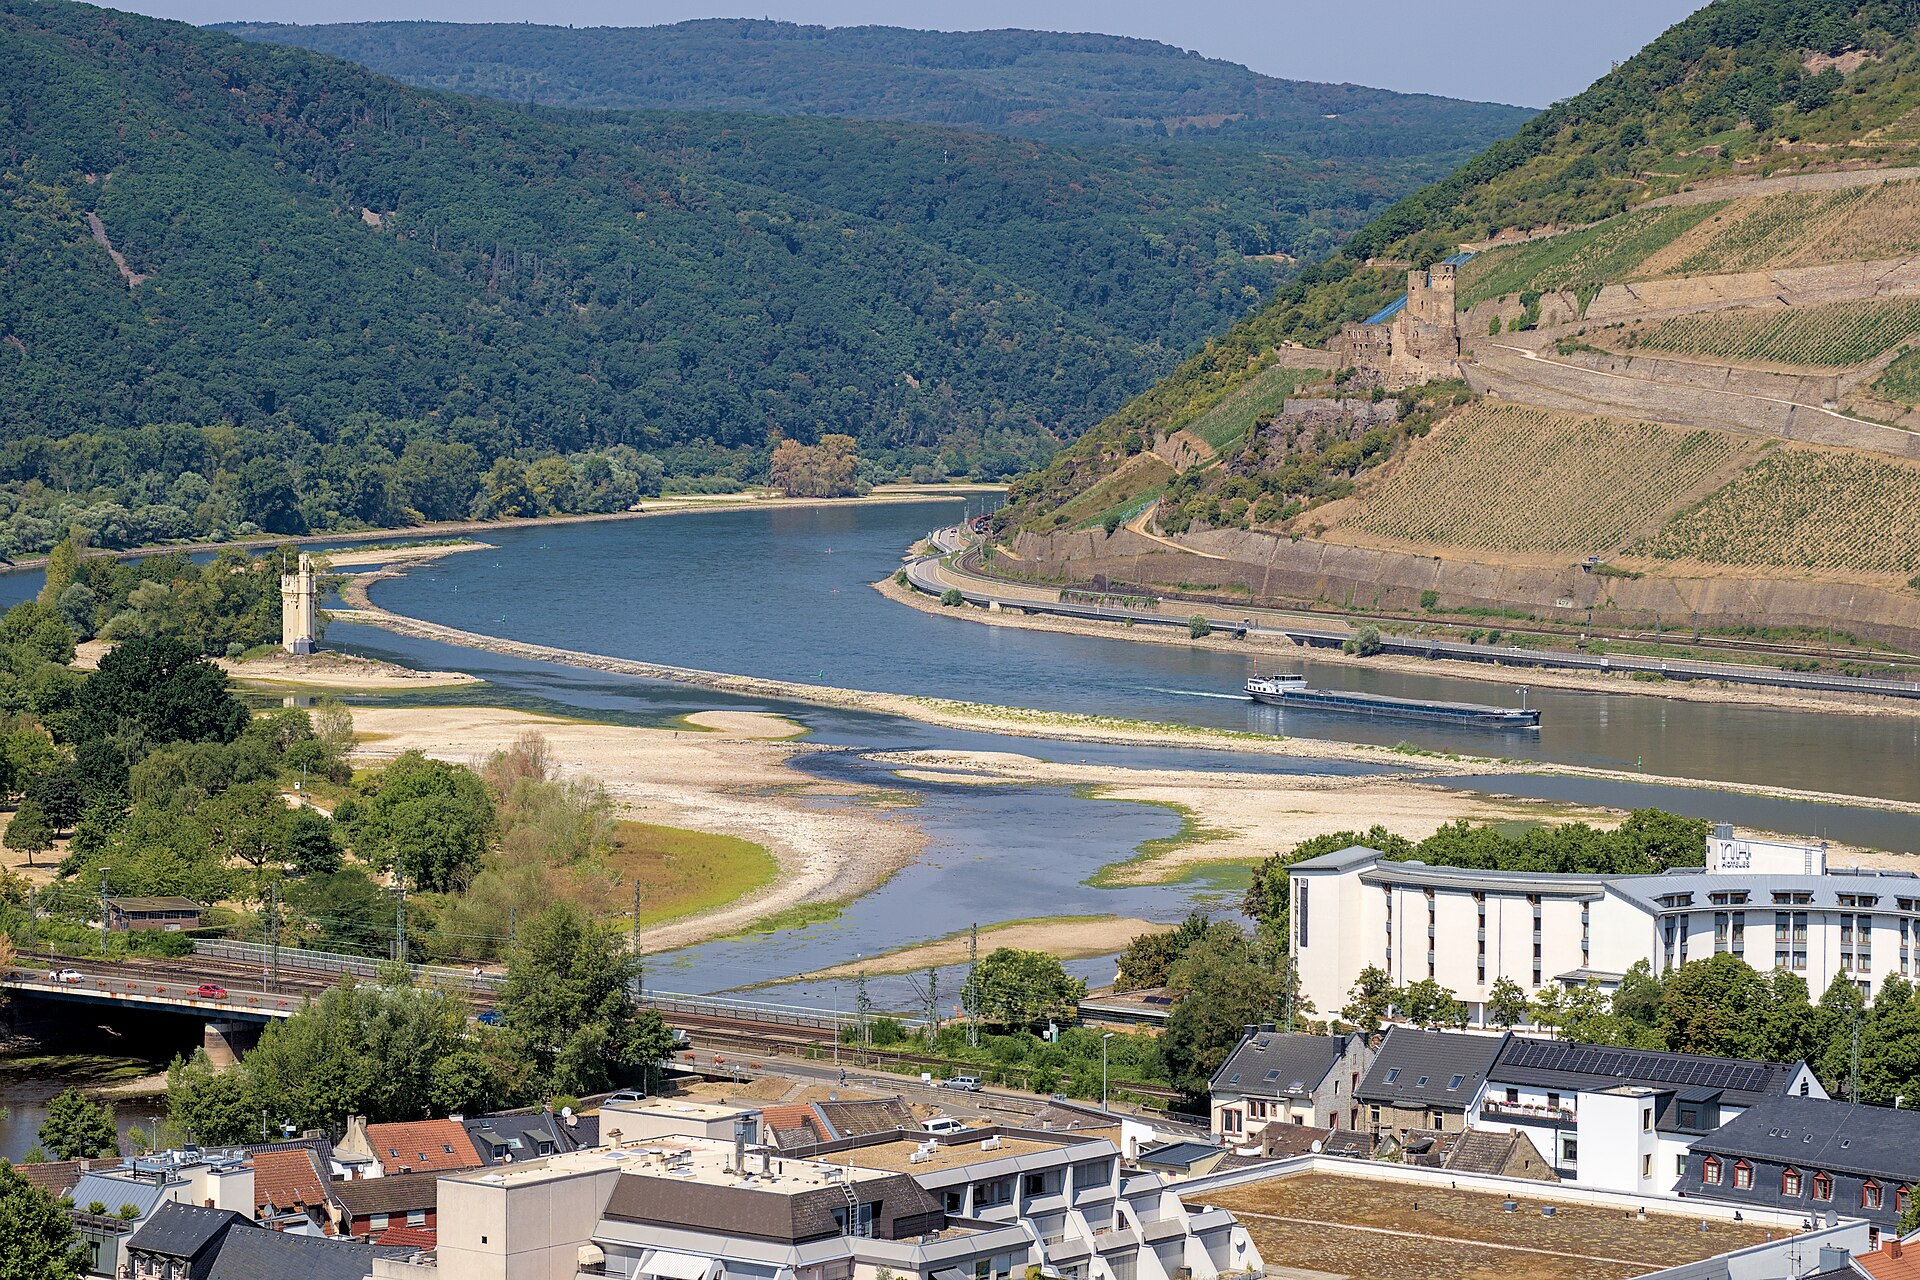
Across the ten systems that report complete hydro and solar data for every year since 2020, hydro generation between June 1 and August 15 came to 31.65 TWh. That is the lowest reading of the seven summers on record, and 6.0% below the drought summer of 2022, when the same ten systems produced 33.69 TWh over the same calendar window.
Solar generation across those same systems was 45.27 TWh in 2022 and 84.44 TWh in 2026. Combined hydro and solar output rose from 78.96 TWh to 116.09 TWh, an increase of 47.0%. The water did less than it did in 2022. The system around it did considerably more.
The two droughts were also not in the same place. In 2022 the deficit was Iberian; by week 31 of 2026 Spanish and Portuguese storage sat 96% and 137% above where it had been that summer, while the shortfall had moved to the Alps, France and the Danube. What the two years share is the quantity of hydro energy the continent got out of the fleet, not where it failed to get it.
One framing point before the detail. Solar did not grow in 2026 because the rivers were low. Capacity was installed on a multi-year schedule that had nothing to do with this summer’s hydrology, and the two simply arrived together. Everything that follows is an accounting relationship between a shortfall and a surplus, not a causal one.
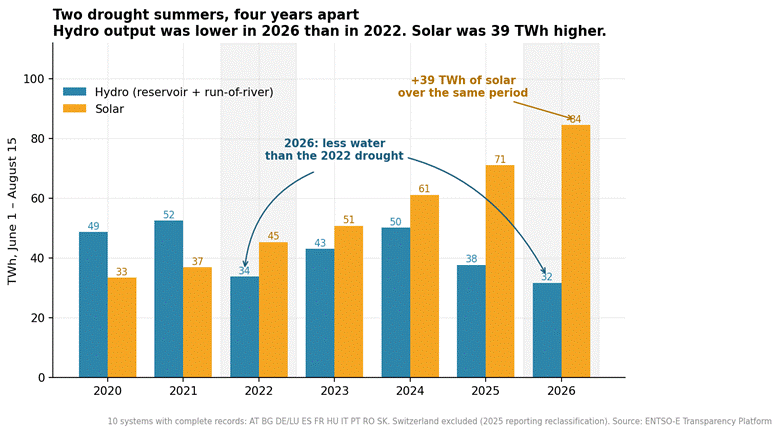
Hydro and solar generation, June 1 to August 15, 2020–2026. Ten systems with complete records. Source: ENTSO-E Transparency Platform
01. The water: a poor summer, unevenly distributed
Reservoir stock across the ten systems with complete filling records back to 2015 stood at 88,499 GWh in week 31, 7.7% below the 2015 to 2025 median for that week and the third-lowest reading in twelve years.
The regional distribution matters more than the total. Measured at week 31, the last week in which every region reported, Iberia sat at 86.7% of its historical band and 22.7% above its median. Everything else sat in the lower quarter: the Danube and South East Europe group at 24.3% of band and 7.8% below median, the Alpine group at 19.7% and 12.7% below, the Nordics at 19.4% and 11.6% below. France, treated separately because it spans two hydrological systems, sat at minus 1.5% of band, fractionally below anything recorded in that week in eleven years.
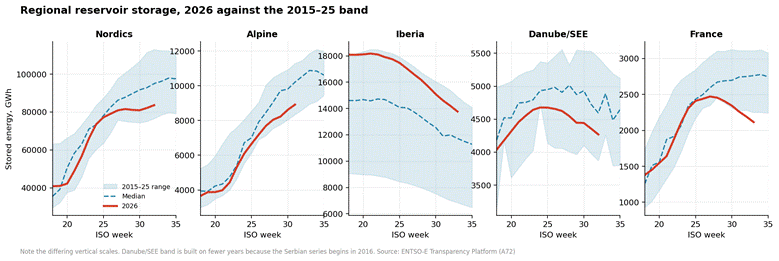
Regional reservoir storage, 2026 against the 2015–25 range and median, weeks 18–35. Note the differing vertical scales. Source: ENTSO-E Transparency Platform (A72)
Position in band is the metric to read here rather than distance from median, because it answers the question that matters for autumn: how does this compare with the worst year on record. France answered badly in four separate weeks, Italy in nine, and French storage closed the period 23.4% below its median.
Generation followed. Reservoir output between June 1 and August 15, measured against each system’s own 2020 to 2025 average, fell 42.7% in Austria, 37.9% in Italy, 29.1% in Romania and 25.9% in France. Swedish output fell 18.3% on a like-for-like 2022 to 2025 baseline, Norwegian output only 2.0%. Spanish output was down 4.7% and Portuguese output rose 32.4%.
Run-of-river, which has no storage buffer and therefore no dispatch decision behind it, fell harder and more uniformly along the drought corridor. Against their 2020 to 2025 averages, the Alpine systems that report it, Austria and Italy, were down 37.0%; the Danube and South East Europe group down 37.4%; France down 29.0%; Germany down 20.1%; Finland, the only Nordic system with a usable run-of-river series, down 12.5%; and Iberia down 3.7%. Austrian, Italian, French, Romanian and Serbian run-of-river output each recorded the lowest reading of the seven-year window.
02. The offset: where solar covered the gap
Against the 2020 to 2025 average, hydro generation across the ten-system panel was 12.61 TWh lower in 2026. Solar generation was 34.74 TWh higher. At continental level the solar increment covered the hydro shortfall nearly three times over, and the combined water-and-sun total reached its highest level in the seven-year record.
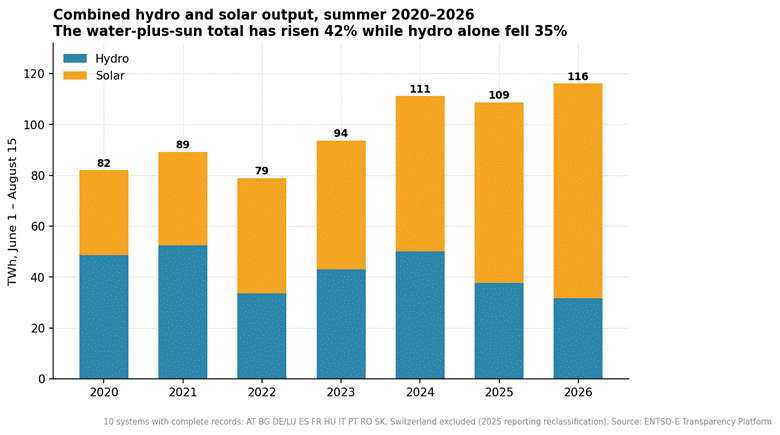
Combined hydro and solar output, summer 2020–2026. The total is 42% higher than in 2020 and 47% higher than in the 2022 drought summer. Source: ENTSO-E Transparency Platform
The continental figure conceals the part that matters operationally, which is that the offset did not land where the deficit did. Spain and Germany account for 54% of the solar increment and neither was under hydrological stress, while the systems that lost the most water were not the systems that gained the most sun. Whether the surplus reaches the deficit therefore depends on interconnection rather than on generation, and on the hours in which the surplus appears.
Across all fifteen systems in the sample, summer solar generation rose from 34.1 TWh in 2020 to 88.7 TWh in 2026, of which the five regions charted below account for 87 TWh, the small remainder being Nordic output. Iberian output more than tripled to 22.2 TWh, French output tripled to 11.7 TWh, the Danube group rose from 1.4 TWh to 6.7 TWh, and German output reached 29.8 TWh.
03. What the surplus did to the rest of the fleet
The clearest evidence that solar has changed the operating logic of European hydro is not in the annual totals. It is in the shape of the average summer day, and two things have moved inside it.
The first is that reservoir hydro has withdrawn from the middle of the day. Across Austria, Germany, Spain, Portugal, France and Italy, the share of reservoir generation delivered between 10:00 and 16:00 local time fell from 25.6% in 2020 to 10.1% in 2026, while the evening share between 18:00 and 23:00 rose from 28.9% to 35.3%. In absolute terms, average reservoir output at 13:00 fell from 1,050 MW to 247 MW across those six systems, while the 21:00 figure was essentially unchanged at 1,500 MW and 1,483 MW. That combination rules out the simplest alternative explanation. Total reservoir output fell sharply over the period, but a fleet that was merely generating less would have scaled down across the whole day. Instead the evening hour held while midday collapsed. Reservoir hydro has stopped competing in the hours solar now fills and concentrated what water it has into the hours solar does not reach.
The second and larger shift is in pumped storage, which has inverted its cycle entirely.
Restricting the analysis to Austria, Germany and Luxembourg, Spain and Portugal, the four systems reporting complete hourly pumping data in every year of the window, the share of pumping energy consumed between 10:00 and 16:00 rose from 28.9% to 71.9% in Austria, from 22.3% to 71.7% in Germany, from 22.7% to 62.5% in Spain and from 23.6% to 64.2% in Portugal. Over the same period the share consumed between midnight and 06:00 fell from 44.9% to 3.3%, from 28.5% to 2.9%, from 33.9% to 1.1% and from 43.4% to 1.2% respectively.
The hour of maximum pumping moved from 04:00 to 13:00 in Austria, from 03:00 to 14:00 in Portugal and from 04:00 to 14:00 in Spain. German pumping, which in 2020 ran a double peak split between the overnight trough and the evening, settled on 14:00.
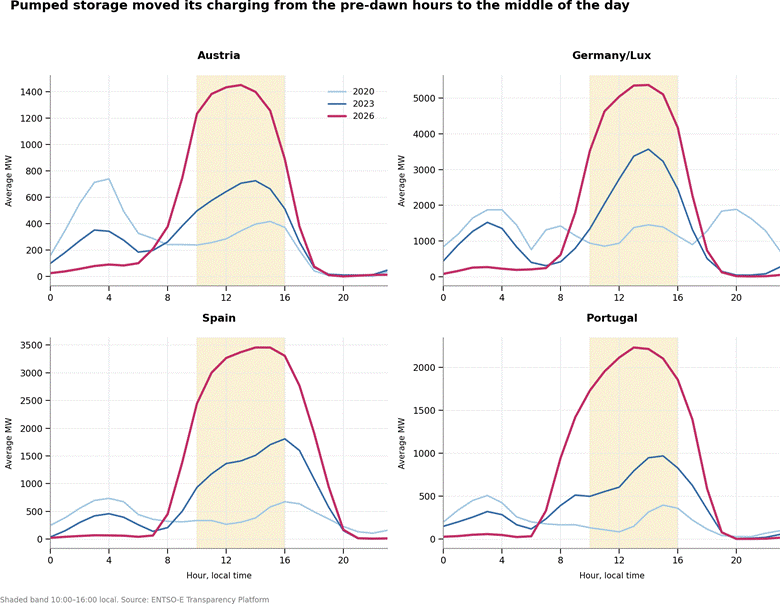
Average pumping load by local hour, 2020, 2023 and 2026. Source: ENTSO-E Transparency Platform
In volume terms the four fleets pumped 3.99 TWh across the window in 2020 and 7.71 TWh in 2026, an increase of 93%. Within that total, midday pumping rose 5.6 times, from 0.93 TWh to 5.21 TWh, while overnight pumping fell 88%, from 1.32 TWh to 0.16 TWh.
Part of that volume increase reflects new plant rather than new behaviour. Peak observed pumping load across the four systems roughly doubled over the period, from 6.9 GW to 14.3 GW at the 99th percentile of hourly load, and Portugal’s Tâmega complex alone added around 1.1 GW between 2022 and 2024. The timing shift does not depend on fleet size. The share of charging falling at midday, the hour of maximum pumping and the correlation with solar output are all ratios, and all three move in the same direction across four independent systems. On those measures, the overnight charging cycle appears to have largely given way to midday charging across all four.
The link to solar is direct and measurable. Across the four systems the correlation between hourly solar generation and hourly pumping load was effectively zero in 2020, with no system rising above 0.03, yet by 2026 it had climbed to between 0.83 and 0.90, a move from no relationship at all to near lockstep in the space of six summers. Over the same period midday pumping rose from 6.9% to 16.0% of midday solar generation. The strength of that correlation is not, in itself, the evidence, since solar output and midday are collinear by construction; what matters is that the relationship changed at all, because solar followed the same daily shape in 2020 and pumping ignored it entirely.
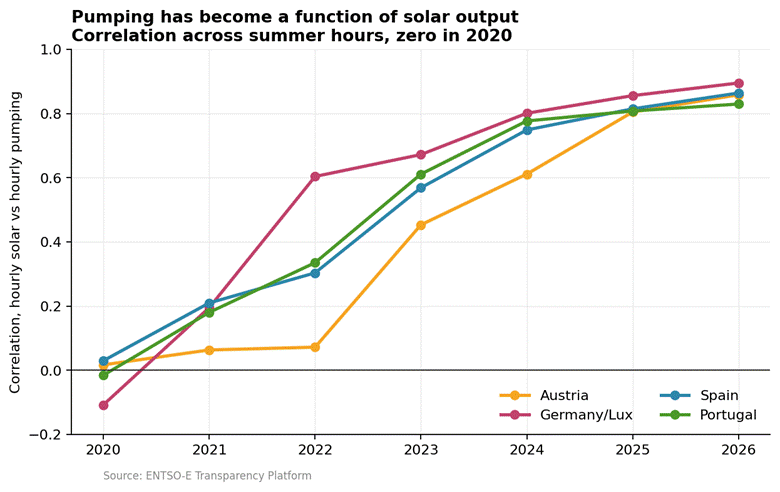
Correlation between hourly solar output and hourly pumping load, by country and year. Source: ENTSO-E Transparency Platform
What did not move is as instructive as what did. The peak discharge hour held at 20:00 or 21:00 in Austria, Germany and Portugal in every year of the sample, and between 20:00 and 22:00 in Spain. The evening peak stayed where it was; the Austrian fleet raised the share of discharge falling between 18:00 and 22:00 from 43.4% to 64.3% and the German fleet from 26.6% to 63.3%, tightening delivery around an unchanged target. All of the adaptation happened on the charging side.

The average summer day in 2020 and 2026: solar, reservoir hydro, and pumped-storage charging and discharge, for the four systems with complete hourly pumping records (Austria, Germany/Luxembourg, Spain and Portugal). The reservoir shares quoted in the text above cover six systems, adding France and Italy, whose pumping data is too partial to chart here. Charging shown as negative. Source: ENTSO-E Transparency Platform
04. Two clocks
Put the three movements together and they describe a single mechanism operating at one end of the system and not the other.
Midday solar output across the four-country panel rose roughly two and a half times. Reservoir hydro pulled out of those hours, cutting its midday share by 60%. Pumped storage moved in, raising midday charging 5.6 times and abandoning the overnight cycle almost entirely. The evening peak, where all three technologies still compete, did not move at all. The daily clock re-optimised itself in six summers alongside significant fleet growth, and it is the ratio-based timing measures, which do not depend on fleet size, that point to a change in dispatch rather than in capacity. The driver is the day-ahead price shape that large midday solar volumes create, and unlike in the drought-and-solar comparison above, it can be measured directly.
That shape has changed decisively, and it shows most clearly once each day is indexed to its own average, which removes the 2022 gas spike and isolates the shape of the day rather than its level. On that basis the midday price in Germany fell from 87% of the daily mean in 2020 to 33% in 2026, and in Spain from 101% to 30%. The cheapest hour of the average summer day moved from around 04:00 to 13:00 in both Austria and Spain, the same window into which pumping migrated, while in Germany, already cheapest in the early afternoon in 2020, it settled one hour earlier at 13:00. The evening-to-midday price ratio, which is immune to the overall price level, widened from roughly 1.5 to 4.8 times in Germany, 1.1 to 4.4 times in Spain and 1.3 to 3.5 times in Austria, and the 2022 gas crisis barely moved it, from 1.5 to 1.7 times in Germany. Negative midday prices, effectively absent in 2020, appeared in 29% of German and 28% of Spanish midday hours in 2026. Pumped storage did not choose midday; it followed the price into it.
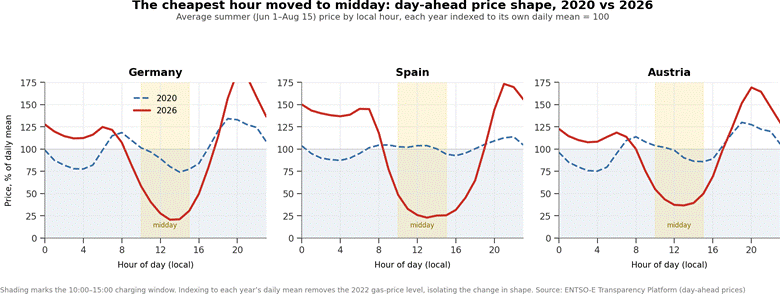
Day-ahead price shape, summer 2020 and 2026, for the three pumping-panel systems with contiguous solar and pumping records. Each year is indexed to its own daily mean so the change in shape is visible independent of the 2022 price level. Portugal couples to Spain through MIBEL and is represented by the Spanish series. Source: ENTSO-E Transparency Platform (day-ahead prices)
The seasonal clock cannot respond in the same way, because reservoir stock is set by inflows accumulated over months and released against a scarcity value that cannot be recovered within the year if the estimate is wrong. A system arriving at mid-August below its eleven-year minimum, as France has, cannot correct before the autumn demand season regardless of how efficiently it cycles each day, and although solar generated 39 TWh more than it did in the comparable drought summer of 2022, none of that surplus could be held back in a reservoir.
That is the boundary of the substitution: solar covered the summer energy gap nearly three times over and rebuilt the middle of the day around itself, but it refilled nothing. The systems that enter September with depleted seasonal storage, France, Italy and Romania in this dataset, will manage that position through the autumn on the same terms they always did, in the hours after the sun goes down.
The share of aggregate midday solar generation currently absorbed by pumped storage in the four-country panel is 16.0%, up from 6.9% in 2020, and it is the number to watch, because it measures how much of the surplus is being time-shifted into the hours where water is scarce. It is growing quickly from a low base in exactly the systems, Germany, Iberia and Austria, that are not the ones under reservoir stress.
The two clocks therefore point in opposite directions, and that divergence is the story of the summer. The daily one is adapting fast, with the absorbed share more than doubling since 2020 and every timing metric moving the same way, while the seasonal one has not moved at all, because no amount of efficient daily cycling refills a reservoir. In a system with this much solar, value is likely to continue migrating toward whatever can bridge that gap, namely storage that shifts surplus from midday into the evening and interconnection that carries it from the sunlit systems to the depleted ones. For anyone pricing hydro, pumped storage or cross-border capacity into the second half of the year, the distance between a daily balance that solar can now close and a seasonal one that it cannot is likely to be an important area to watch.
How WSP’s Electricity Market Outlook can help
These are the types of questions assessed using WSP’s Electricity Market Outlook (EMO), which helps clients test how hydro portfolios, pumped-storage assets and cross-border positions may perform under different weather, market and policy scenarios. The underlying model, PRIMES-IEM, has supported European Commission policy analysis for two decades. It runs European markets simultaneously to 2050, with cross-border flows derived by replicating the EUPHEMIA algorithm used by ENTSO-E. Outputs include hourly prices, capture rates, hydro and cooling-water sensitivities, curtailment exposure and storage profitability projections at country and asset level.
Author: Safa Sen, Market Engagement Lead for CWE at WSP
WSP is one of the world’s leading engineering, science and infrastructure solutions firms, uniting its multidisciplinary expertise to shape communities to advance humanity. From local beginnings to a globe-spanning presence today, WSP operates in over 50 countries and employs approximately 83,000 professionals, including 12,100 across the UK and Ireland. Together, our Visioneers pioneer solutions and deliver innovative projects in the transportation, infrastructure, environment, building, energy, water, and mining and metals sectors. WSP is publicly listed on the Toronto Stock Exchange (TSX:WSP).
The views and opinions expressed in this article are the author’s own, and do not necessarily reflect those held by pv magazine.
This content is protected by copyright and may not be reused. If you want to cooperate with us and would like to reuse some of our content, please contact: [email protected].
Please login to comment