US solar deployment hits lowest level in two years (w/ charts)

Q3 was not the best quarter for the U.S. solar industry, and it could get worse before it gets better. According to the latest figures from GTM Research and Solar Energy Industries Association (SEIA) across the nation 2.03 GW of solar PV was installed, slightly below Q2 2016, which saw 2.05 GW.
There are no simple answers to why the industry saw this slump, and instead a variety of factors can be seen. A 51% year-over-year decline from Q3 2016 has more to do with the volume of projects initially planned for completion before the 30% Investment Tax Credit (ITC) was extended to 2020, than it does with the weakness this past quarter.
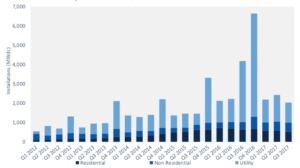
A look by segments shows that residential solar continues to struggle. While this is the third quarter of year-over-year decline, residential installation volumes were also 10% lower than the previous quarter.
GTM Research primarily cites national third-party solar companies scaling back in an effort to “prioritize profitability over growth”. This can be amply seen in the quarterly results of Tesla and Vivint, the nation’s first- and third-largest residential solar companies.
But it is not only residential solar that declined, as the utility-scale market saw a mere 1 GW installed. It is unclear how much of this is due to the inevitable quarter-to-quarter fluctuations in volume as large projects come online, however increased prices and difficulty in securing modules did not help.
Module, system price increases
GTM Research found that the price of modules rose to $0.45 per watt in the third quarter, the highest level in a year, as developers and contracts scrambled to ensure adequate supplies of tariff-free modules in advance of the Section 201 case.
And while system prices are still lower than they were a year ago, GTM Research reports that such prices increased 1.3-2.1% across all market segments, the first time they have seen this since the U.S. Solar Market Insight report series began in 2010.

Report co-author SEIA was sure to warn that the worst is yet to come if President Trump imposes strong trade action.
“The solar industry is a resilient bunch, but this quarter shows us what happens when policy uncertainty becomes a disruptive factor: prices rise, supplies shift and the market reacts accordingly,” said SEIA President and CEO Abigail Hopper.
“We urge President Trump to reject tariffs and allow solar to continue its amazing growth for the U.S. economy, national security and American families in all 50 states.”
Bright spots: C&I and new markets
However the Q4 2017 U.S. Solar Market Insight report is not all gloom and doom. The “non-residential segment”, which includes commercial and industrial, non-profit and government installations, grew 22% year-over-year. This was boosted by growth in community solar, which the report puts in this segment.
This was particularly true in Minnesota, whose high volume of solar deployed in 2017 sets a new bar for Midwestern states. But Minnesota has not been the only surprise. Texas was the third-largest market during Q3 with over 228 MW installed, more than the state put online in all of 2015.
Florida also arrived as the 5th-largest solar market, and GTM Research places it as the second-largest market for utility solar, with three utilities announcing a combined 2.4 GW of solar between 2017 and 2022. Texas and Florida are also the second- and third-largest U.S. states by population, which indicates that solar deployment is moving towards being more evenly distributed throughout the United States, and less clustered in California and a few other states, although California still has the lion’s share of deployment to date.
Q4 and beyond
GTM Research notes that 4 GW of utility-scale solar is currently under construction, and expects 2017 to finish with a grand total of 11.8 GW of solar across all segments, down 22% from the surge in 2016, which was driven by the scheduled expiration of the Investment Tax Credit (ITC).
This new 2017 forecast is a slight downgrade from the 12.4 GW the company previously forecast, and GTM Research cites “continued challenges” in residential solar, as well as a push-back in project completion timelines due to uncertainty around the Section 201 case.
Looking to 2018 and beyond, GTM Research and SEIA warn of “considerable downside risk” presented by both the Section 201 process and the current tax reform process.
As reported by pv magazine, it is still unclear if the final tax bill will contain the Base Erosion Anti-Abuse Tax (BEAT) provision in the form passed by the U.S. Senate, which could greatly damage the ability of investors to monetize the Investment Tax Credit (ITC).
Correction: The headline in this article has been changed. The headline initially stated that Q3 was the lowest level of deployments in a year and a half, based upon data published on the SEIA site. SEIA has since clarified that this data is out-of-date, and as such Q3 was the lowest level of deployment in two years. We have changed the headline accordingly.

Please login to comment