The U.S. Department of Energy’s Energy Information Administration (EIA) is the official source of data on the nation’s electricity system, and since it started tracking distributed PV a few years ago, solar is no longer an exception.
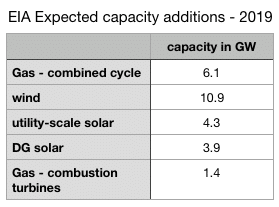
Last week the EIA announced its projections for new capacity to come online in 2019, including solar and wind. And while the organization did not include distributed solar in the graphics in a post it published for Today in Energy, it gave an estimate of new distributed solar via its Short-Term Energy Outlook. The two sources indicate 4.3 GWac of utility-scale solar and 3.9 GWac of distributed solar for modest market growth on what analysts think was installed last year.
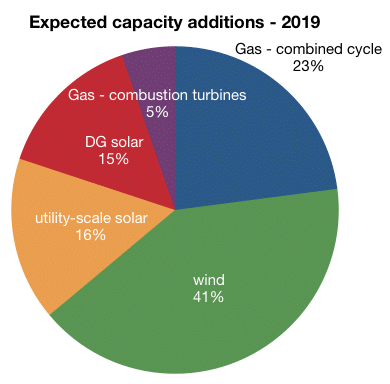
Overall, the EIA expects solar and wind to dominate new capacity additions, as they have for most of the decade. Last year may have been an exception, due to a rush to build gas plants mostly in the PJM Interconnection in the eastern U.S.
Final 2018 numbers are not confirmed, but based on projections by analysts at Wood Mackenzie and IHS Markit, it appears the capacity of new natural gas plants was going to narrowly exceed new renewables.
Geography, retirements and additions
This year appears set to herald a return to renewables dominance of new capacity additions. One of the biggest factors affecting the market in 2018 was the retirement of an estimated 11.9 GWac of coal plants, and the EIA expects the pace of decommissioning to slow this year, with the retirement of the 2.3 GWac Navajo Generating Station making up roughly half of the 4.5 GWac of coal expected to be retired.
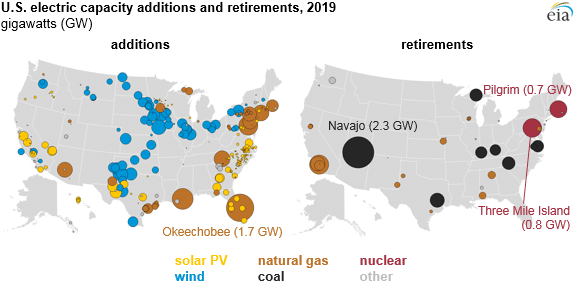
The map of retirements and additions shows many familiar elements, such as wind plants coming online in the Plains States and gas being added in the northeast and Florida. However, there are some quirks, such as a massive gas plant being added in Louisiana, and utility-scale solar coming to Florida and Texas. As the map does not show distributed solar, the geography of such additions is less clear.
Popular content
Market could beat expectations
If anything, the EIA’s forecast for solar may prove conservative. It can be challenging to compare the EIA’s figures to those made by Wood Mackenzie and the Solar Energy Industries Association (SEIA) in the U.S. Solar Market Insight report series, as the EIA uses AC values and Wood Mackenzie DC. However, assuming a DC:AC ratio of 1.25:1 for distributed solar and 1.4:1 for utility-scale, produces EIA forecasts of around 10.9 GWdc of solar for 2019.
That appears to be slightly below Wood Mackenzie’s projection, as that organization expects 7.2 GWdc of utility-scale solar alone this year, well above the EIA forecast.
In Today in Energy, the EIA claims its track record for 12-month forecasts is solid. However, the organization concedes 660 MWac more solar came online in 2017 than was expected at the end of 2016 – not hard to imagine given that in many ways solar development is still a ‘Wild West’ industry and entails heavy work collecting data from every developer. There is also the complication that projects don’t always happen on the timelines developers predict.
The massive volumes of solar projects in the interconnection queues of grid operators also suggest much more solar could be coming than anyone has forecast.
On New Year’s Day, pv magazine reported there are 139 GWac of solar projects in the interconnection queues of six grid operators. Since that time, figures from the Southwest Power Pool have pushed the total up to 164 GWac – and bear in mind that doesn’t cover the South or most of the Mountain West.
This content is protected by copyright and may not be reused. If you want to cooperate with us and would like to reuse some of our content, please contact: editors@pv-magazine.com.

1 comment
By submitting this form you agree to pv magazine using your data for the purposes of publishing your comment.
Your personal data will only be disclosed or otherwise transmitted to third parties for the purposes of spam filtering or if this is necessary for technical maintenance of the website. Any other transfer to third parties will not take place unless this is justified on the basis of applicable data protection regulations or if pv magazine is legally obliged to do so.
You may revoke this consent at any time with effect for the future, in which case your personal data will be deleted immediately. Otherwise, your data will be deleted if pv magazine has processed your request or the purpose of data storage is fulfilled.
Further information on data privacy can be found in our Data Protection Policy.