Italian solar redrew the day, but gas still sets the price

The Italian summer changed the shape of the power day more than its size. Solar produced 13.8 TWh between June and August and held the middle of the day, but a hot season lifted demand by 5.2 TWh while hydro and wind fell 2.7 TWh, and gas covered most of what was left, adding 6.4 TWh and pushing its share of generation toward half. Prices split the same way, rising least in the hours solar owns and most after sundown, so the exposure that once ran across the whole day now concentrates in the evening, where gas still sets the price.
Solar added 1.1 TWh, gas 6.4 TWh
Italian solar produced 13.8 TWh over June to August, 1.1 TWh more than the same months of 2025, while gas added 6.4 TWh over the identical window, taking it to 30.4 TWh and lifting its share of Italian generation from 40.6% to 47.7%.
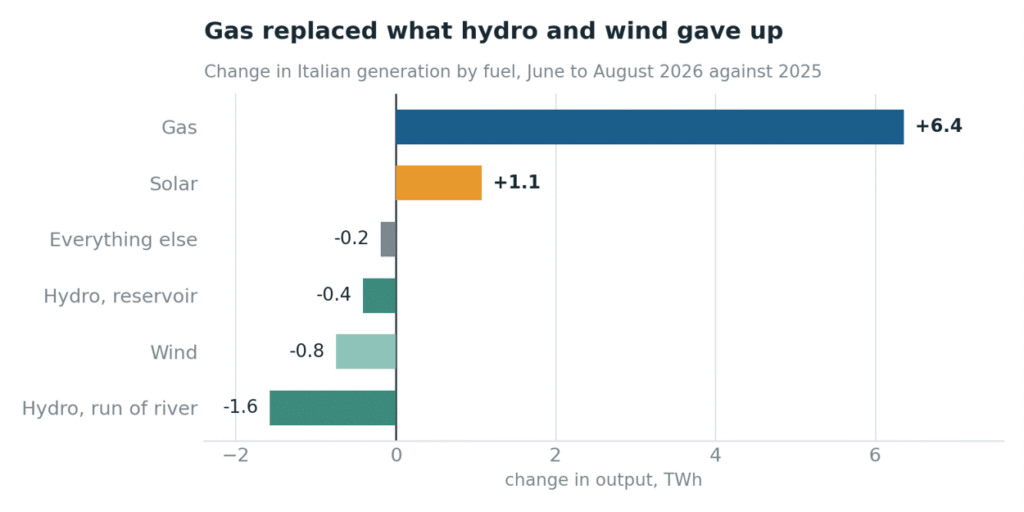
The gap covered by PV
Year on year demand lifted by 5.2 TWh, while hydro and wind gave up 2.7 TWh between them, run of river down 20.1%, reservoir down 27.0% and wind down 16.5%. The hydro loss came with exceptionally low river levels in the north, where the Po fell to a record low at the end of July and ran at under a third of its seasonal norm. That leaves a gap of 7.9 TWh to be covered. Gas met 80% of it and solar 14%, with higher net imports covering a further 8%, so gas and solar between them account for almost all of the domestic response. The demand growth was heat driven rather than structural. Across twelve Italian cities the mean summer temperature ran 1.7 C above 2025.
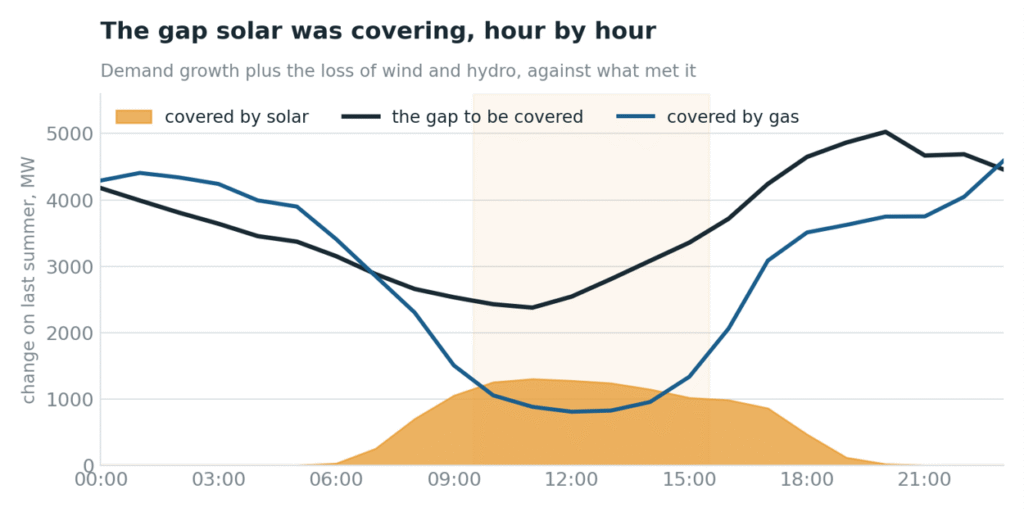
Demand grew at least at midday, but that explains only part of it. The gap to cover was 2.8 GW at midday and 3.9 GW overnight, so the midday gap was around a third smaller. Gas answered far more unevenly, adding just 1.0 GW at midday against 3.7 GW across the evening peak and 4.2 GW overnight. Its weakest response of the day coincided with the strongest solar, which added 1.2 GW over last summer in precisely those midday hours.
What the price shape shows
The wholesale reference price for electricity (PUN) averaged €156.5 ($182.1)/MWh over the three months, €45/MWh above last summer, with every zone up between 38.0% and 44.2%. Only 66 of 2,182 priced hours cleared below €60/MWh, against €84/MWh of 2,208 last summer.
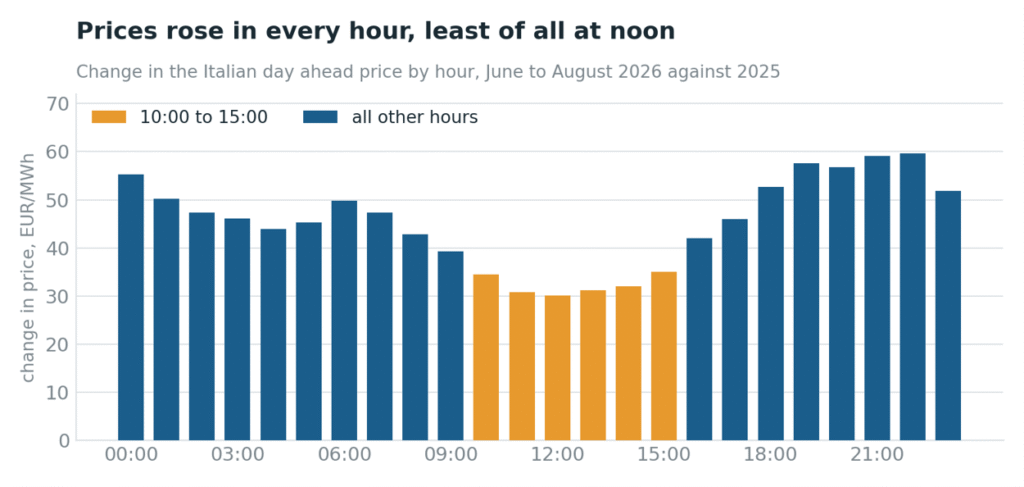
Every hour was dearer than last summer, but the increase concentrated after sundown, at about €57/MWh across the evening peak against €32/MWh at midday. That divergence is a solar artefact, not a market judgement in the middle of the day. Matching hours on residual demand collapses the midday discount from €33/MWh to under €4/MWh, which attributes the great majority of it to solar rather than to the shape of demand, but the level does not disappear with it. Like for like across the day, Italian prices sat about €35/MWh above last summer. Solar itself captured €133.4/MWh, 36 more than a year earlier, but it lagged the rise in baseload, so its capture rate slipped 2.3 points to 85.3%.
What holding midday costs the gas fleet
Gas rose at both ends of the day and barely at midday.
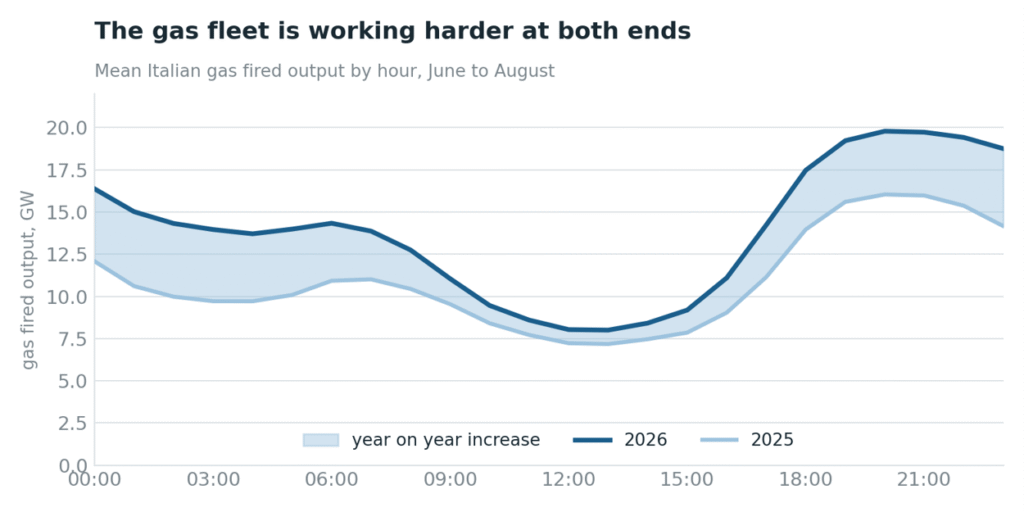
That same uneven response made the fleet cycling harder within the day. The 1.0 GW added at midday against 3.7 GW in the evening widened the swing between those two windows from 7.8 GW to 10.4 GW. Day by day, the distance between each day’s highest and lowest gas hour grew by 2.7 GW to reach 12.3 GW, and the widest day reached 18.0 GW. The fleet is not running less. It is moving further within the day, with output up in every one of the twenty four hours, by 0.8 GW at the shallowest.
The national picture has room to spare, the south does not
The national average conceals a wide zonal range.
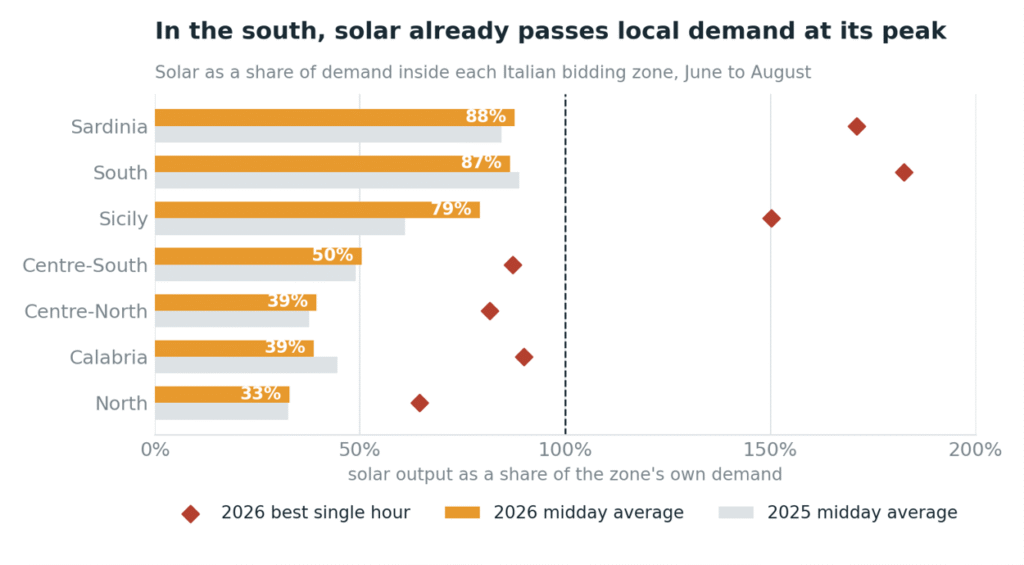
In IT South, solar averaged 86.6% of the zone’s own demand across the middle of the day and reached 182% in its best single hour, while Sardinia averaged 87.7% and reached 171%, and IT North, which carries more than half of Italian demand, averaged just 32.8%.
Sicily added the most solar of any zone, 0.5 TWh for a 42.1% rise, and recorded the largest capture decline, down 4.5 points to 80.9%, level with Sardinia at the bottom of the Italian range. In absolute terms its solar still earned the most of the southern zones, €132.5/MWh against €131.3/MWh in IT South and €123.7/MWh in Sardinia, but it earned that against Italy’s highest zonal baseload of €163.7/MWh, and the gap between the two is what pulls its capture rate to the bottom.
IT South and Sardinia already generate more solar than they consume in about a quarter of their midday hours, Sicily in one in seven. Where that surplus cannot be exported the zonal price collapses to zero, as it did in thirteen hours in IT South and nine in Sardinia, while the North still cleared around €80/MWh.
Solar delivered what was forecast
If solar had been the source of this summer’s stress it would show up as output fell short of what the market expected, and it did not.
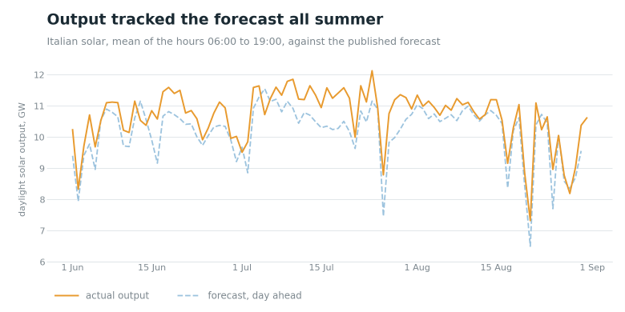
Across the three months Italian solar came in 4.9% above the published day ahead forecast, beating it on 83 of the 91 days that carried one. Of those 91 days, midday solar came in more than 5% below forecast on four, more than 10% below on two, and more than 25% below on none, while across daylight hours, 06:00 to 19:00, the mean absolute hourly forecast error was 664 MW, or 6.2% of mean output.
What this means for the Italian market
Resource risk arrived together, and solar could not offset it. Hydro and wind gave up 2.7 TWh in the same season that demand added 5.2. Solar rose, but it clears a gigawatt in only thirteen hours of the day, so it covered 14% of a gap that ran through all twenty four hours and left most of the rest to gas.
The exposure sits in the evening rather than in the middle of the day. Midday prices rose 35.5% against 41.3% in the evening, and gas widened its own midday to evening gap from 7.8 GW to 10.4 GW as the burden shifted into those hours.
Capture erodes at zone level first, and the national average hides it. The 85.3% headline masks Sicily at 80.9%, down 4.5 points after 42.1% output growth, and IT South and Sardinia, which already generate more than their own demand in about a quarter of their midday hours. A national price curve does not reveal those zonal differences.
The level of Italian prices still appears to be set by gas. Only 66 of 2,182 priced hours cleared below €60/MWh, and every zone rose between 38.0% and 44.2%. Solar changed the distribution of Italian prices across the day this summer. It did not change what sets their level.
One caution applies throughout. The demand growth behind the gap was heat, and heat reverses. All of it came in July and August, and June demand came below last year, so if next summer is milder and hydro recovers, the 2026 figures read as a single year rather than a trend. What holds regardless is the shape. Solar serves the part of the day it generates in, and gas serves the rest.
How WSP’s Electricity Market Outlook can help
These are the types of questions assessed using WSP’s Electricity Market Outlook (EMO), which helps clients test how solar portfolios, storage assets and cross-border positions may perform under different weather, market and policy scenarios. The underlying model, PRIMES-IEM, has supported European Commission policy analysis for two decades. It runs European markets simultaneously to 2050, with cross-border flows derived by replicating the EUPHEMIA algorithm used in the EU Single Day Ahead Coupling. Output includes hourly prices, capture rates, hydro and cooling-water sensitivities, curtailment exposure and storage profitability projections at country and asset level.
Author: Safa Sen, Market Engagement Lead For CWE at WSP.
WSP Group unites engineering, advisory and science-based expertise to shape communities to advance humanity. From local beginnings to a globe-spanning presence today, it operates in over 50 countries and provides solutions and delivers innovative projects across sectors: Transport & Infrastructure, Property & Buildings, Earth & Environment, Water, Power & Energy and Mining & Metals.
The views and opinions expressed in this article are the author’s own, and do not necessarily reflect those held by pv magazine.
This content is protected by copyright and may not be reused. If you want to cooperate with us and would like to reuse some of our content, please contact: [email protected].
Please login to comment