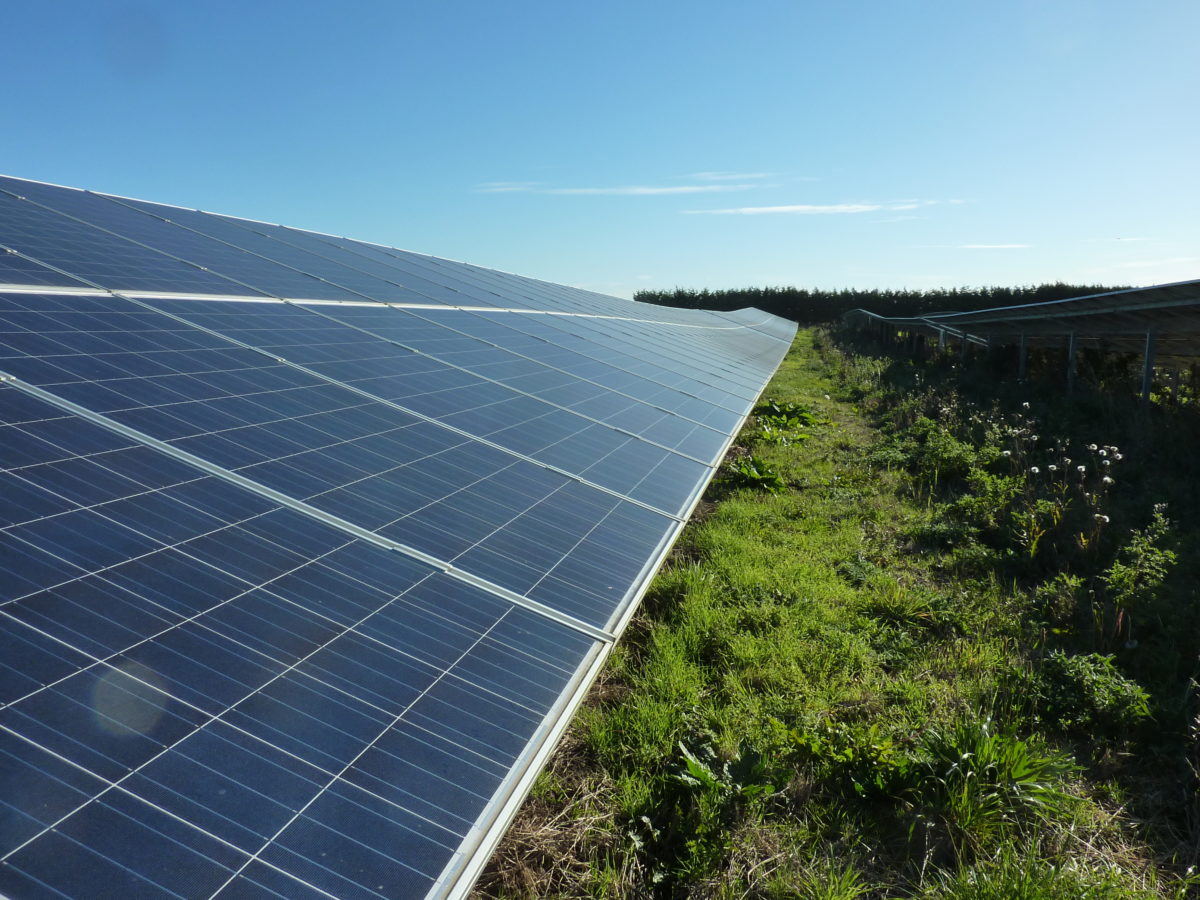
Sometimes explanations are not convincing. For example, when an O&M-provider blames the weather on a 45% drop in the yield of a solar PV installation in the course of one year.
This is exactly what happened with a five-year-old installation in the United Kingdom, where after a routine inspection, high yield loss became obvious. Prior to this, the asset owner had no idea the plant was underperforming.
“First, the visual inspection did not reveal more than some snail trails,” said Lucie Garreau-Iles, Technical Regional Manager, EMEA at DuPont Photovoltaic Solutions. But they were few and, therefore, the result provided some reassurance that the occurrence of broken cells was low.
pv magazine Virtual Roundtables Europe 2020
How can asset managers, O&M-contractors, and project developers ensure high yields? And to what extent can they increase them? These essential questions will be discussed at the 2020 pv magazine Roundtable Asset Management session. Join us on June 9 to meet speakers from Allianz Global Investors, JinkoSolar, DuPont Photovoltaic Solutions, and Ariel Re. More information and free registration.
Following this visual inspection, Garreau-Iles analyzed the yield data and discovered a significant drop in the plant's operational capacity, specifically, of around a third from year three to year four. This was not reflected in the performance ratio communicated by the O&M-contractor. He observed a stable performance ratio around the agreed target of 79.5%. That is why the O&M-contractor blamed the yield drop on the weather.
Fault 1: Weather station
“However, the weather does not effect this kind of variability from year-to-year,” said Garreau-Iles. Furthermore, data from nearby weather stations showed that the drop in irradiation was negligible between the two years. The investigation of the solar plant’s weather station proved that it was not working as it should. The conclusion was that the yield drop corresponded to a performance problem and hinted at some fault in the installation.
In a second visit, Garreau-Iles and her colleagues had a hand-held IR camera with them. With this, they discovered thermal patterns associated with hotspots and potential induced degradation (PID). “But the hot spots were not so bad that they raised concerns,” she said. Lss than 2% of the modules had a temperature increase of more than five degrees.
Fault 2: Potential induced degradation
The PID can, however, lead to a rapid degradation in performance, which is in the order of magnitude observed. Additionally, the cables out of the panels’ junction boxes were hot, having been tied with a too tight radius of curvature, which would stress the connections and promote high contact resistance. However, Garreau-Iles said that this was not the main cause of the yield drop, since the potential-induced degradation was visible with thermal imaging.
Popular content
Thus, the conclusion was that two faults existed. The PID led to a loss in yield of about one third. Since the irradiation was measured incorrectly in the same order of magnitude, this drop in power generation was incorrectly assessed. “Furthermore, the degree of power loss was consistent with the checkboard pattern of well-established PID.”
Conflict of interests
So why would an O&M contractor not highlight the reduced production in the case that the PR was good? One of the reasons is that the O&M-contract focuses on a performance ratio target, and not on a target for the overall energy production, explained Garreau-Iles. The contractor gets no bonus points for revenue and this forces his attention to the performance ratio.
Some contractors are penalized when the performance ratio falls below a certain value. “Therefore, it is better to believe that the irradiation was low than to admit a lower performance ratio,” said Garreau-Iles.
“As for the potential induced degradation the O&M-contractor can hardly do anything to avoid falling the performance ratio below the promised level and to influence the performance ratio.”
Therefore, she concluded that instead of using the performance ratio as key performance indicator for the O&M contractor, it would be much better to use fault detection, response time, ground maintenance, preventative maintenance; or measures that are completely under the control of the contractor and relevant to the performance assessment.
Questions for the roundtable
- Are there estimations of how often performance ratios are measured too high due to faulty weather stations or soiled sensors? How can asset managers make sure this does not happen?
- What should be known of the quality and maintenance of weather stations?
- Could up-to-date-data acquisition have helped automatically detect the PID and increased resistance caused by too tight wiring?
- What are the best and most fair key performance indicators for O&M-contractors?
- Which other risks should the O&M-contractor be aware of, such as loss in electronic insulation, which is not reflected in the performance ratio?
- News from the PID testing – what do we know about the PID-vulnerability of today’s modules?
This content is protected by copyright and may not be reused. If you want to cooperate with us and would like to reuse some of our content, please contact: editors@pv-magazine.com.


By submitting this form you agree to pv magazine using your data for the purposes of publishing your comment.
Your personal data will only be disclosed or otherwise transmitted to third parties for the purposes of spam filtering or if this is necessary for technical maintenance of the website. Any other transfer to third parties will not take place unless this is justified on the basis of applicable data protection regulations or if pv magazine is legally obliged to do so.
You may revoke this consent at any time with effect for the future, in which case your personal data will be deleted immediately. Otherwise, your data will be deleted if pv magazine has processed your request or the purpose of data storage is fulfilled.
Further information on data privacy can be found in our Data Protection Policy.