Brent, fuels and CO2
The prices of Brent oil futures for the M+2 product in the ICE market showed an increasing trend during the first part of the first half of 2019 until reaching a maximum value for the period, of $74.57/bbl on April 24. Since then the a downward trend has occurred although towards the end of last month it started to recover, settling on Monday at $65.05/bbl.
The main factors that pushed oil prices up in the recently-ended half-year were the political crisis in Venezuela, geopolitical tensions between the United States and Iran, and OPEC production cuts. It appears the OPEC cuts will be extended until the first quarter of next year, as agreed by member states on Monday, although that decision is still pending ratification by countries not belonging to the group. However, it is the commercial conflict between the United States and China which was the main factor that caused prices to fall.
The TTF gas front month futures on the ICE market recorded a downward trend throughout the first half, reaching historical minimum values for the last two years. Between the first and the last session of the first half of the year, the price decreased 58%.
Similarly, the API 2 coal front month futures prices on the ICE market kept falling throughout the first half, with a 42% drop between January 2 and Friday’s session. This market has been strongly influenced by more competitive gas prices and oversupply worldwide throughout the first half.
The CO2 emission rights futures prices on the EEX market for the reference contract of December 2019, ended the first half with an increase of 3.8% on the beginning of the year. During the first quarter or so – until the first week of April – prices oscillated between €18.80/t and €25.40/t and then started vertiginous growth to reach historical maximum values of €7.54/t, the settlement price of April 23, the highest of the half-year. After that rise, prices remained between €21.90/t and €27.60/t. During the first half, volatility was closely related to news of Brexit negotiations.
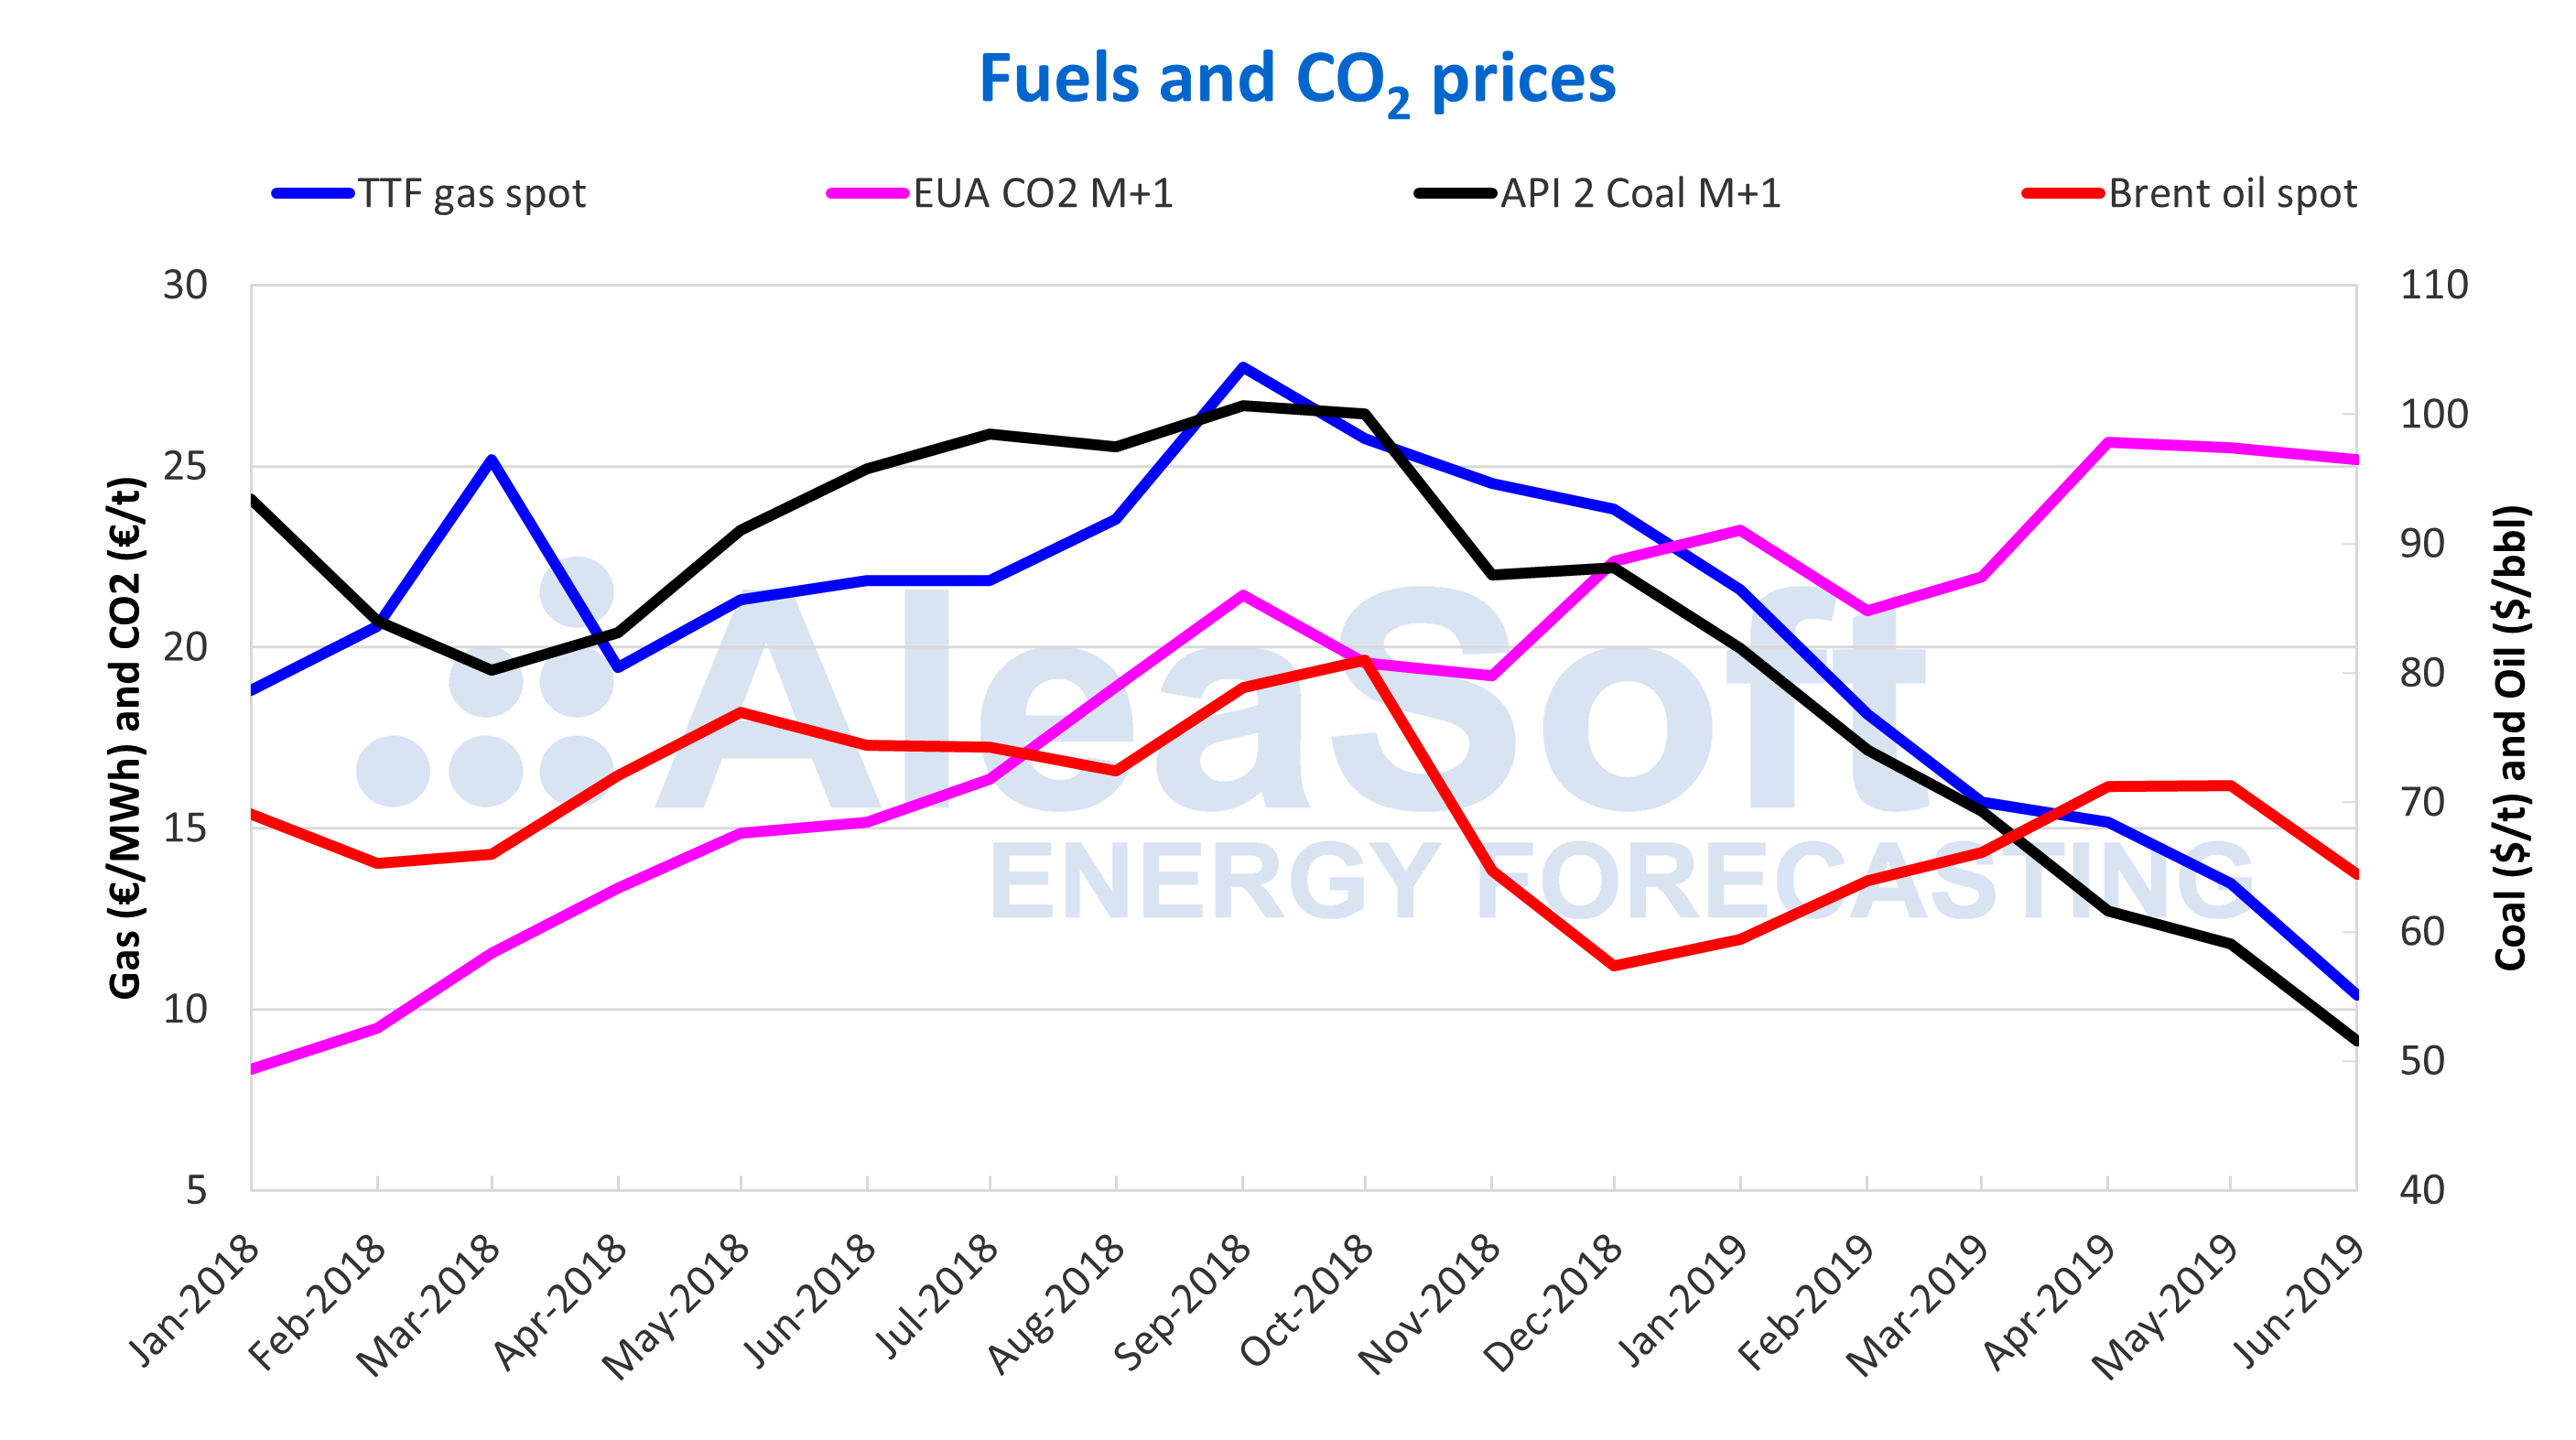
Sources: Prepared by AleaSoft using data from PEGAS, ICE, EIA and EEX.
European electricity markets
The main wholesale European electricity market prices registered an important fall during the first half. After the upward trend of CO2 emission rights prices in the first half of 2018 slowed slightly from October and, most of all, due to the fall in the gas and coal prices since then, electricity market prices did not stop falling. The most important decline was recorded on the EPEX SPOT market of Belgium, with a fall of 37% in the first half compared to the second half of last year. Price drops in the other EPEX SPOT markets of Germany, France and the Netherlands were around 30%, while for the MIBEL market of Spain and Portugal, the IPEX market of Italy and the N2EX market of Great Britain, they retreated around 20%. The market with the smallest price decrease was the Nord Pool of the Nordic countries, which fell 16%.
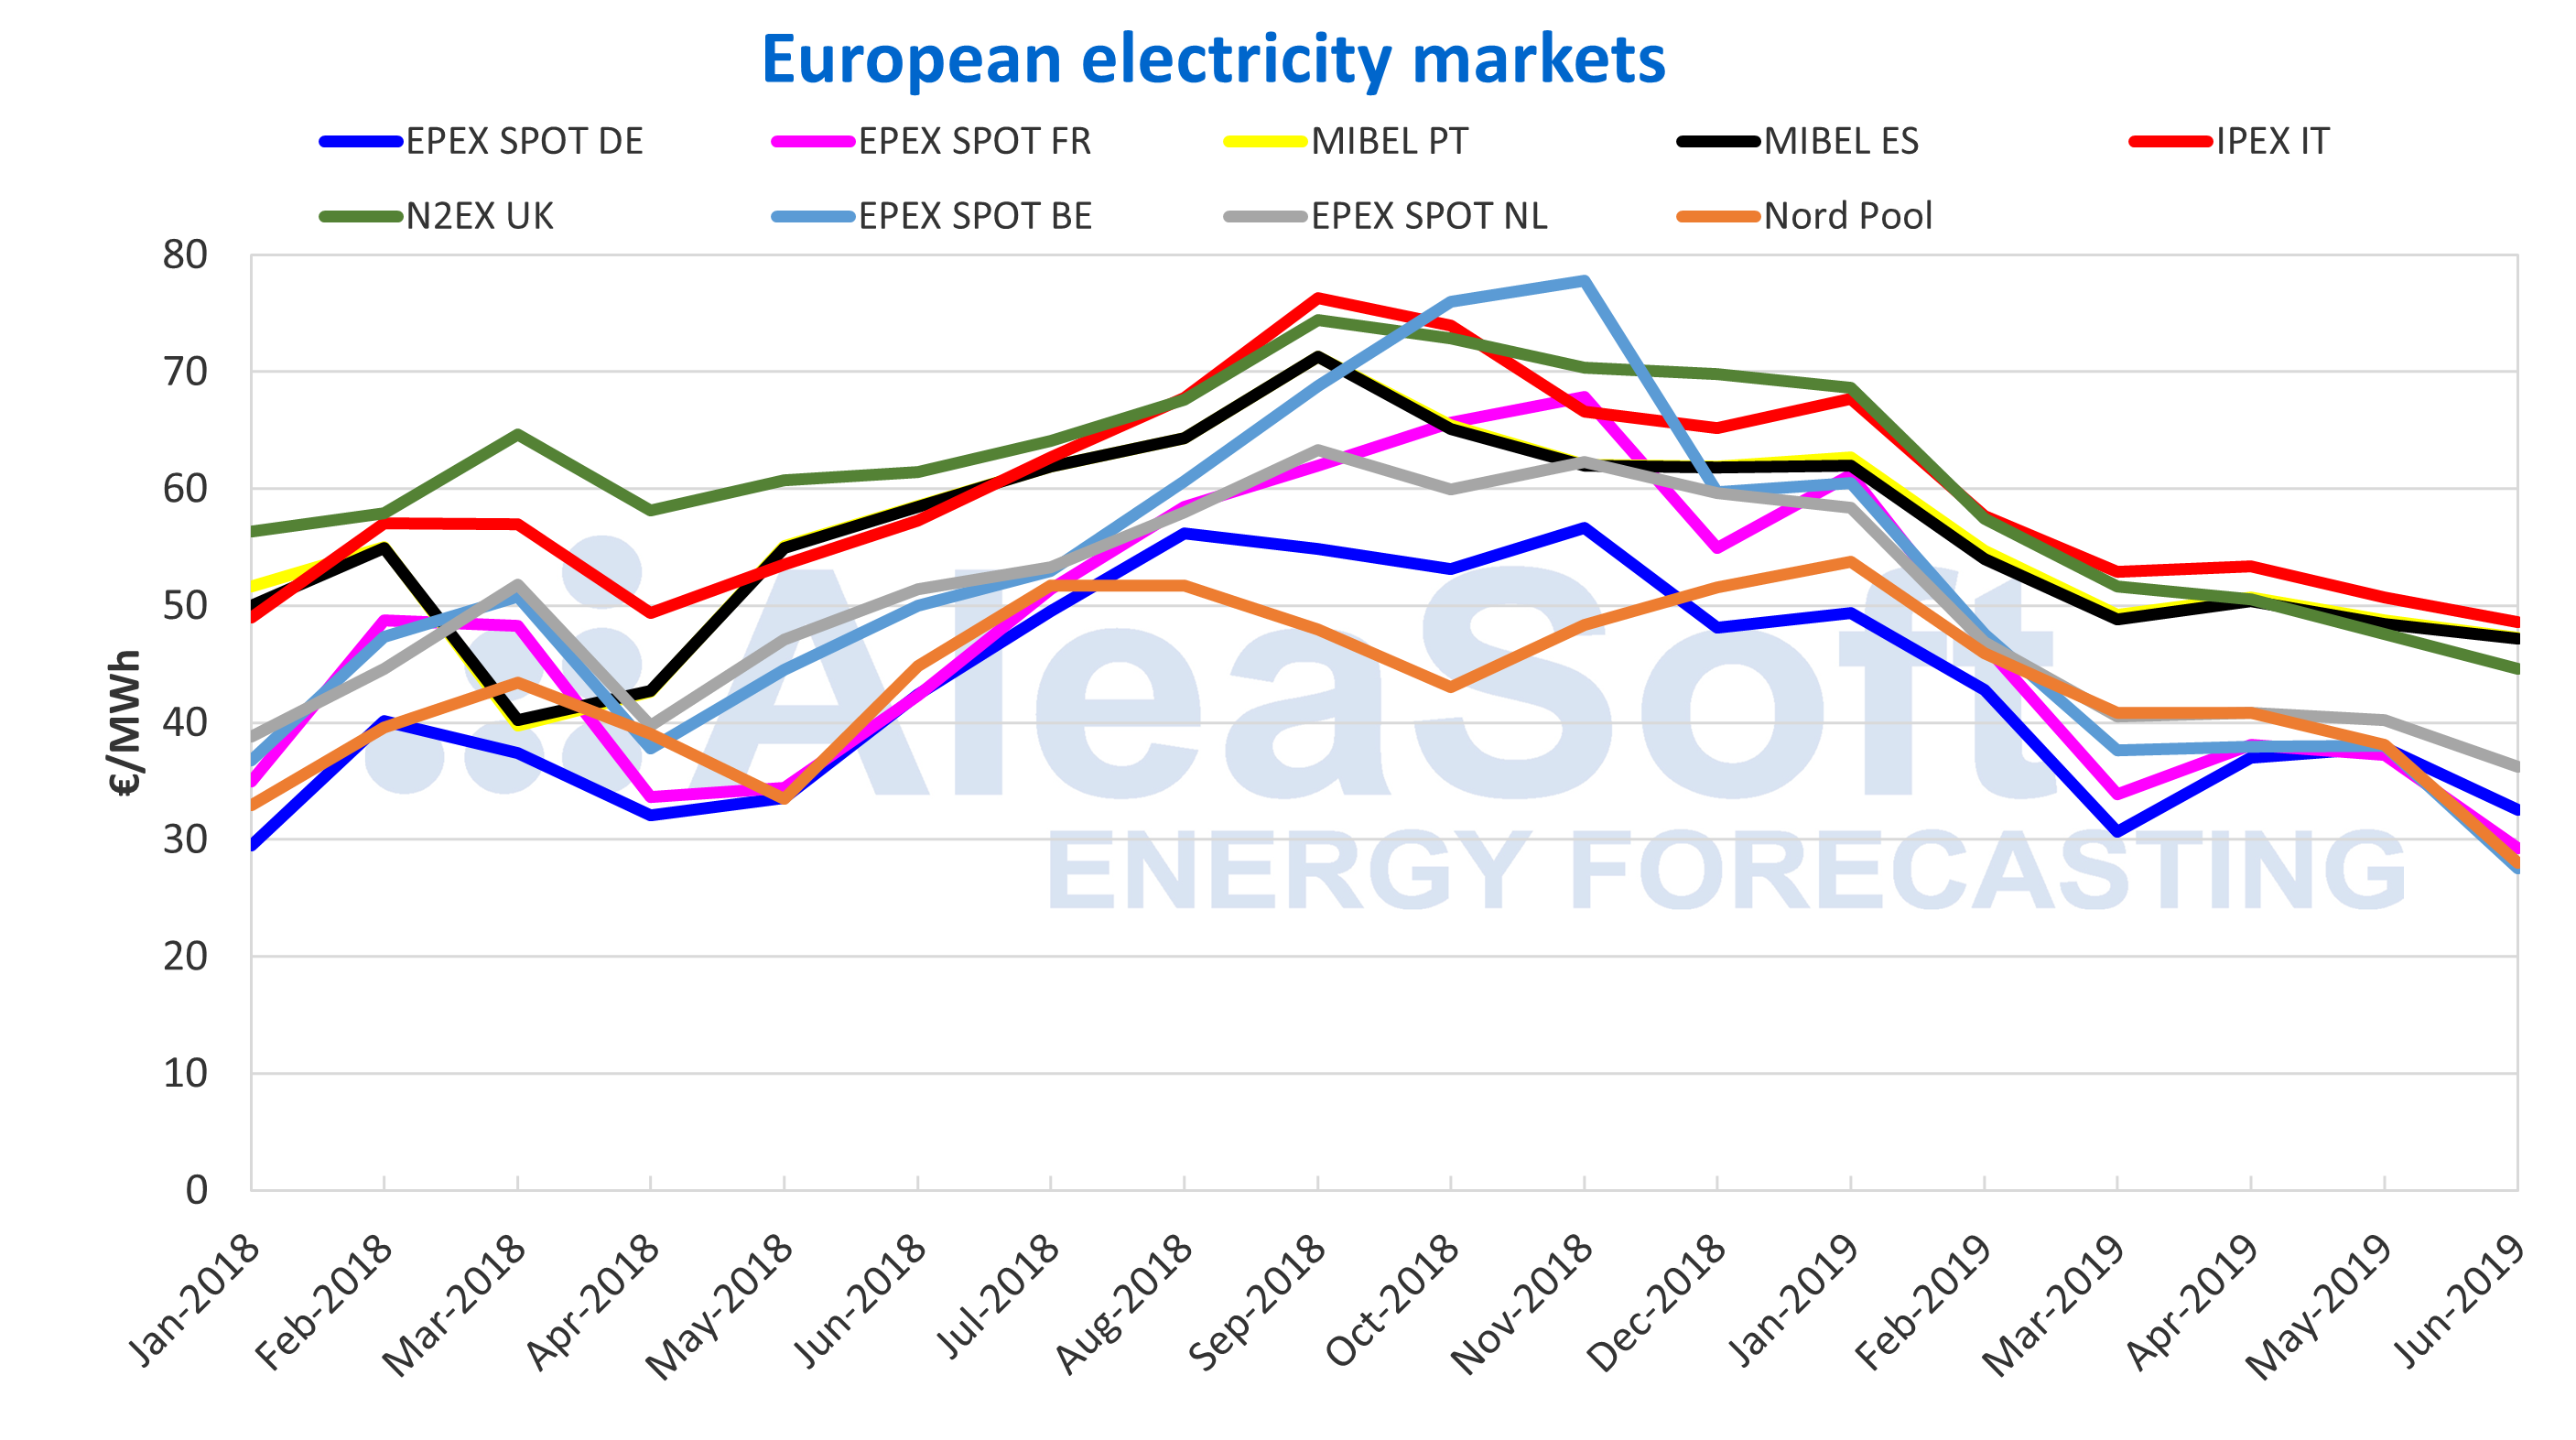
Sources: Prepared by AleaSoft using data from OMIE, EPEX SPOT, N2EX, IPEX and Nord Pool.
Regarding the price level, the most expensive market during the first half was the Italian market, with an average price of €55.14/MWh. Also in the group of markets with the highest prices during the last six months were Spain, Portugal and Great Britain. About €10/MWh below those markets, the group of countries with the lowest prices were Germany, France, Belgium, the Netherlands and the Nordic countries. The market with the lowest price on this occasion was the EPEX SPOT of Germany, with an average price of €38.33/MWh during the first six months of 2019.
Wind and solar energy captured price
In general in the first half, the wind and solar non-dispatchable renewable technologies captured price, with respect to the average market price, has been reduced compared to the captured prices of last year.
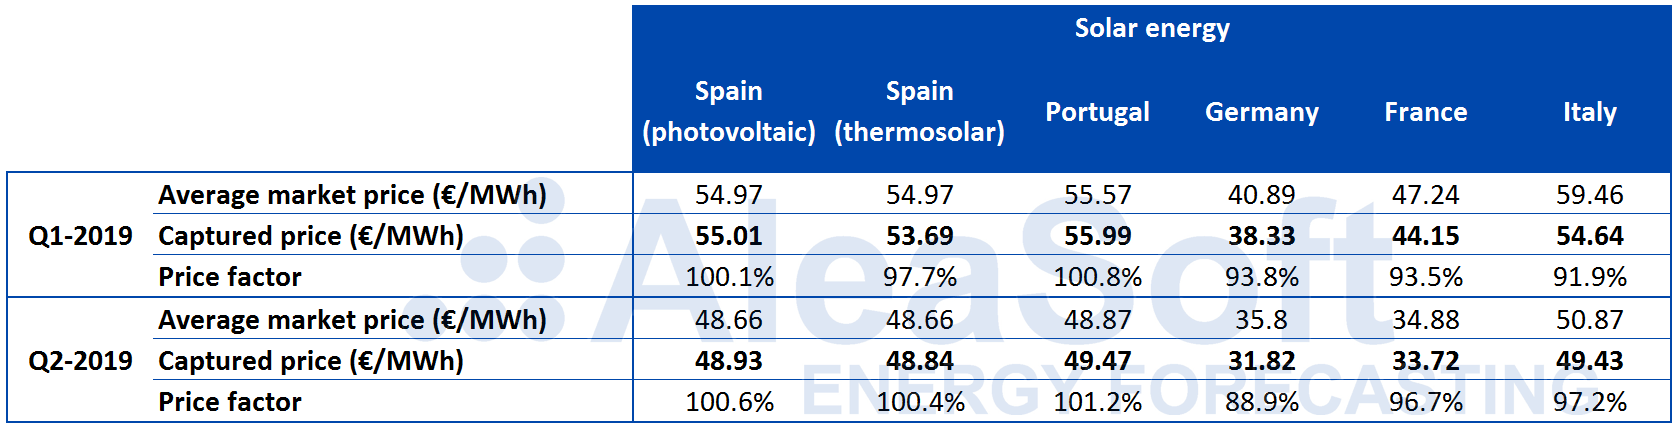
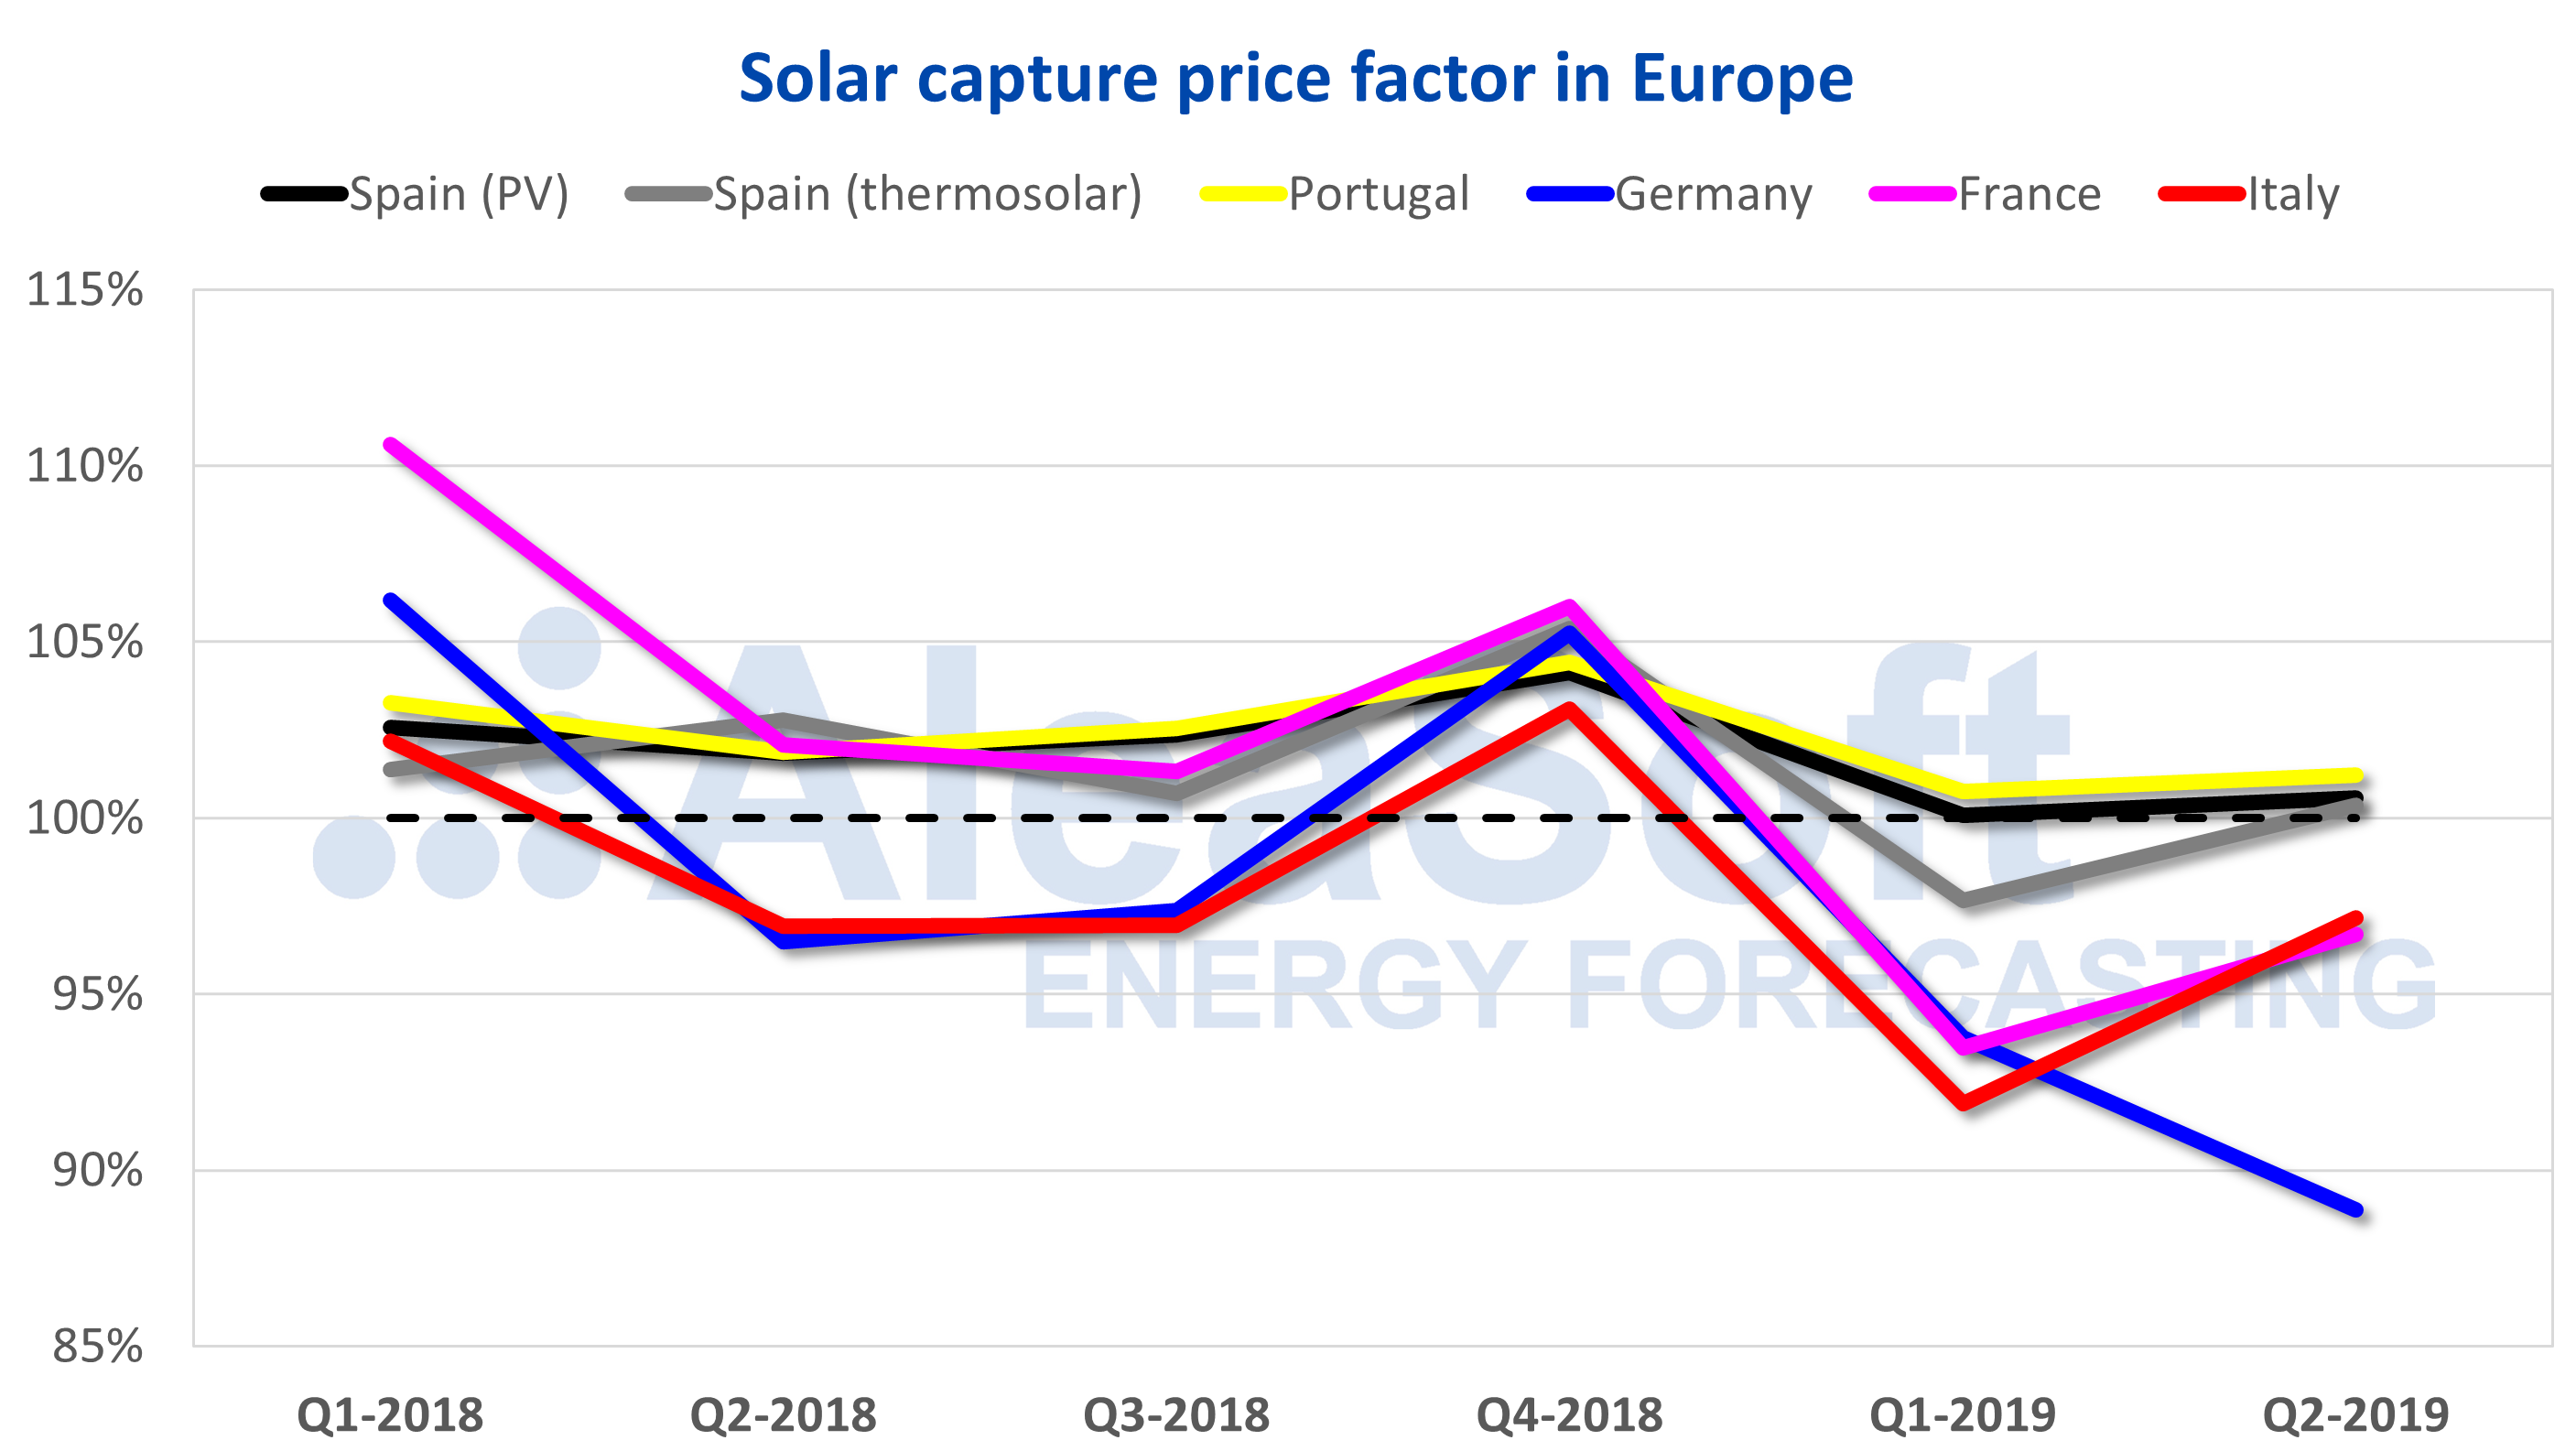
The solar PV captured price for each of the four quarters of last year was above the average market price for Spain, Portugal and France. For each of the first two quarters of this year, the captured price fell below the average market price in Portugal and France and was clearly reduced for Spain without falling below, with a price factor of a few tenths above 100%. In Germany and Italy, which did score below 100% during the second and third quarters of 2018, in the first two quarters of this year the price factor fell below 98%, reaching 88.9% for the second quarter in Germany.
In the case of solar thermal technology in Spain, the captured price also fell below the average market price during the first quarter. During the second quarter the price factor recovered up to 100.4%.
Source: Computations carried out by AleaSoft using data from OMIE, EPEX SPOT, IPEX, REE, REN, ENTSO-E and Terna.
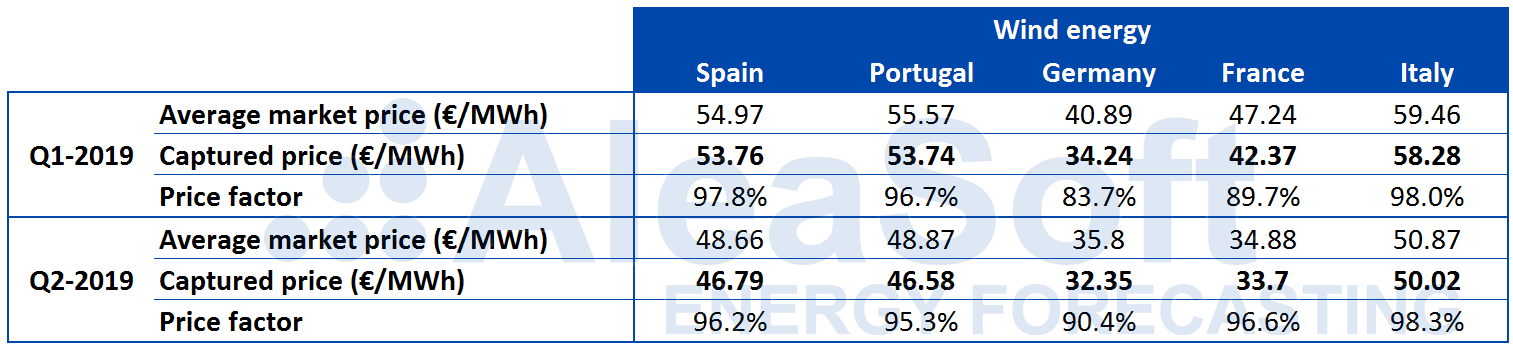
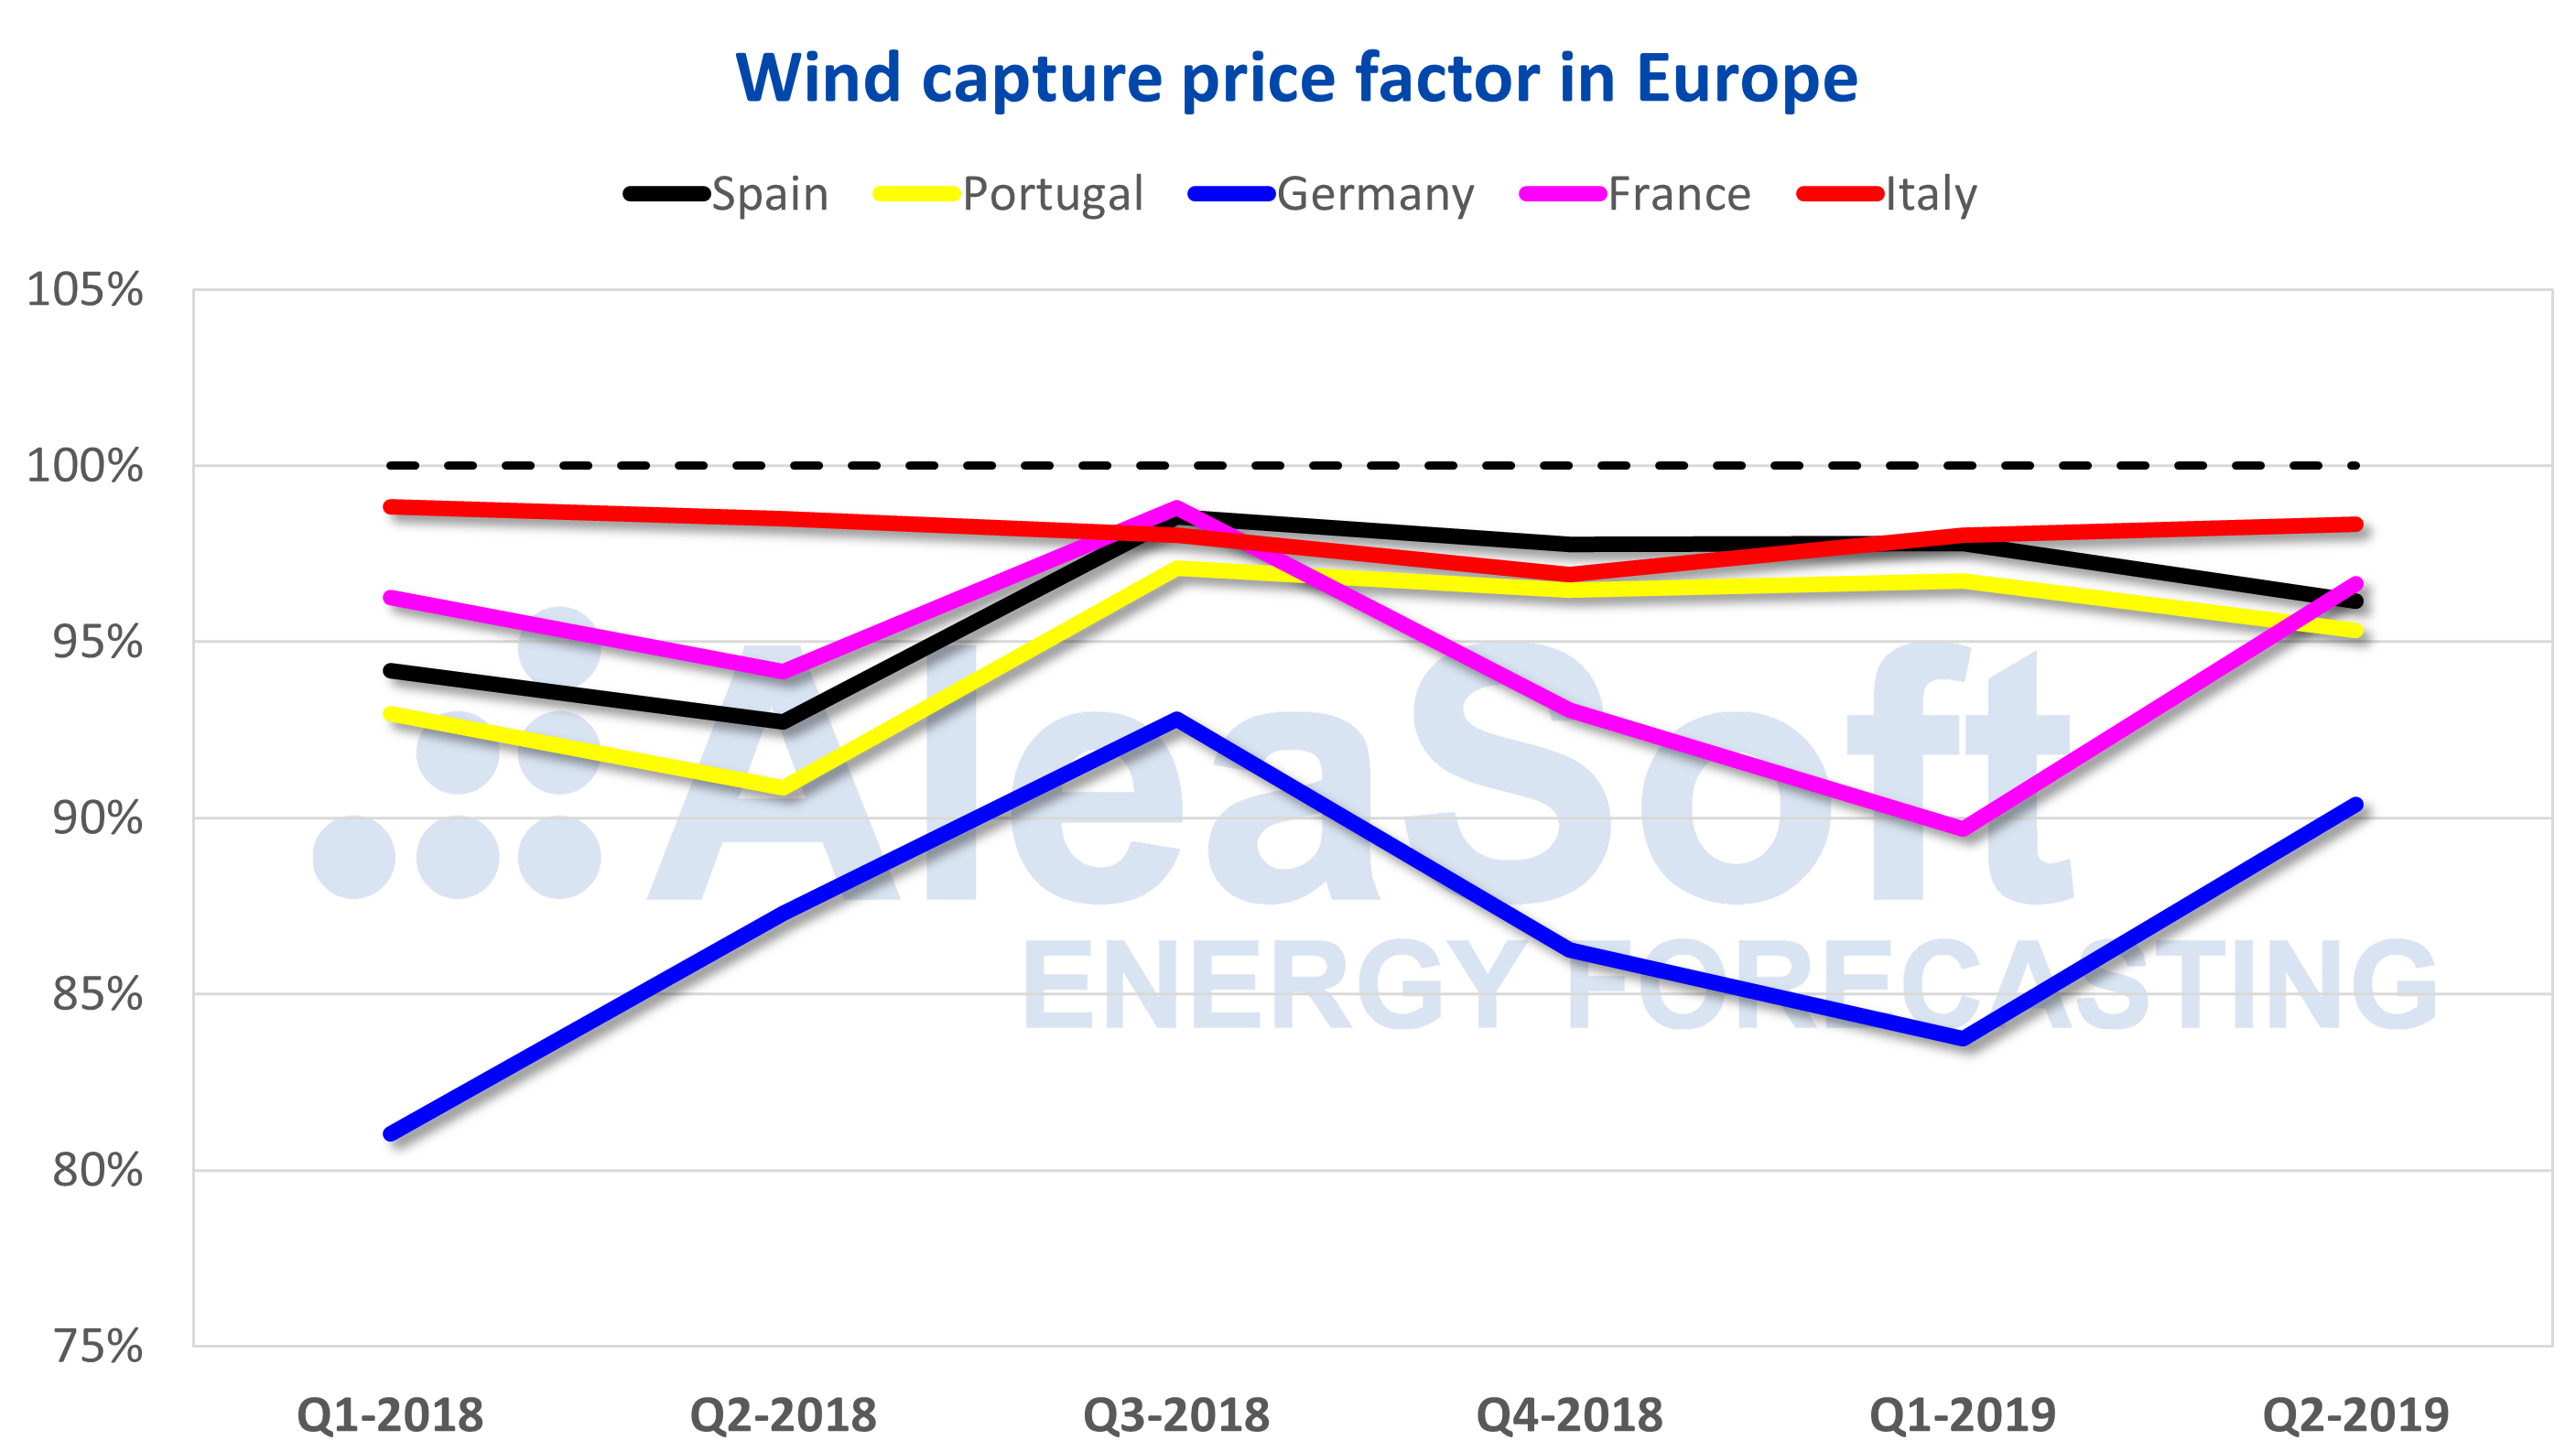
For wind energy, the fall in the captured price compared to the average price of the market was not as widespread. The values of the wind energy price factor are usually less than 100%, and in the case of Germany it reached 83.7% in the first quarter, although that value was an improvement on the 81% in the first quarter of last year. There were also registered increases in the price factor during the first two quarters in Spain and Portugal. In France and Italy, the values of the wind energy price factor fell slightly.
Source: Computations carried out by AleaSoft using data from OMIE, EPEX SPOT, IPEX, REE, REN, ENTSO-E and TERNA.
Electricity futures
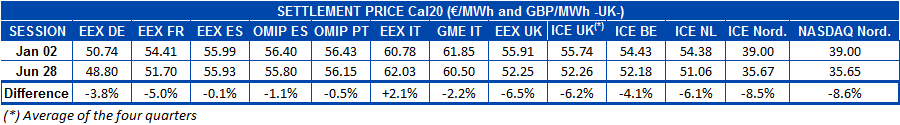
During the first half, the electricity futures of the main European markets for 2020 followed the same downward trend of the spot markets. Dragged by the price fall in gas and coal futures, electricity futures prices fell around 4.5% after the first session of the year, on January 2. However, the range between different markets was quite broad: from 8.6% in the Nordic countries to 0.1% for Spain in the EEX market. The exception was the Italian futures in the EEX market, which during the first half experienced a 2.1% rise, the opposite for the commodity in the MTE market of GME, that fell by 2.2%.
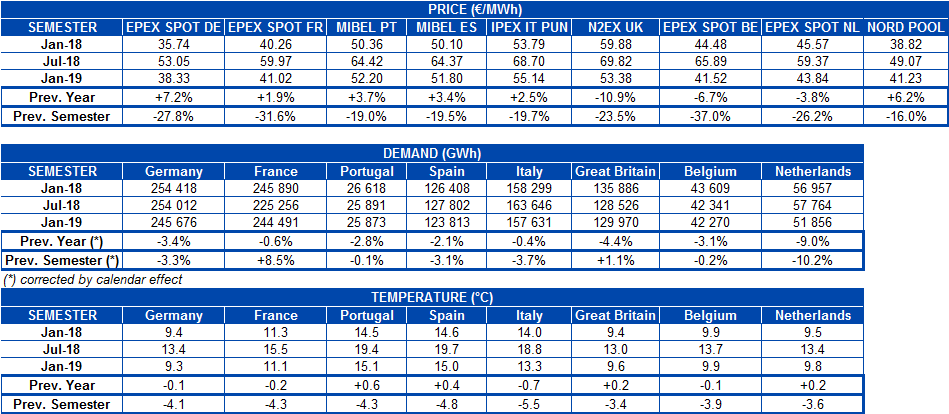
European electricity demand
During the first half, electricity demand of all analyzed European countries decreased compared to the same period of last year. If the second quarter of the year is analyzed, demand for electricity decreased in most countries except France, where it rose 3.9% in year-on-year terms. The average temperatures of the first half were in general similar to those of the same period of last year, with absolute differences that did not exceed 1 degree Celsius.
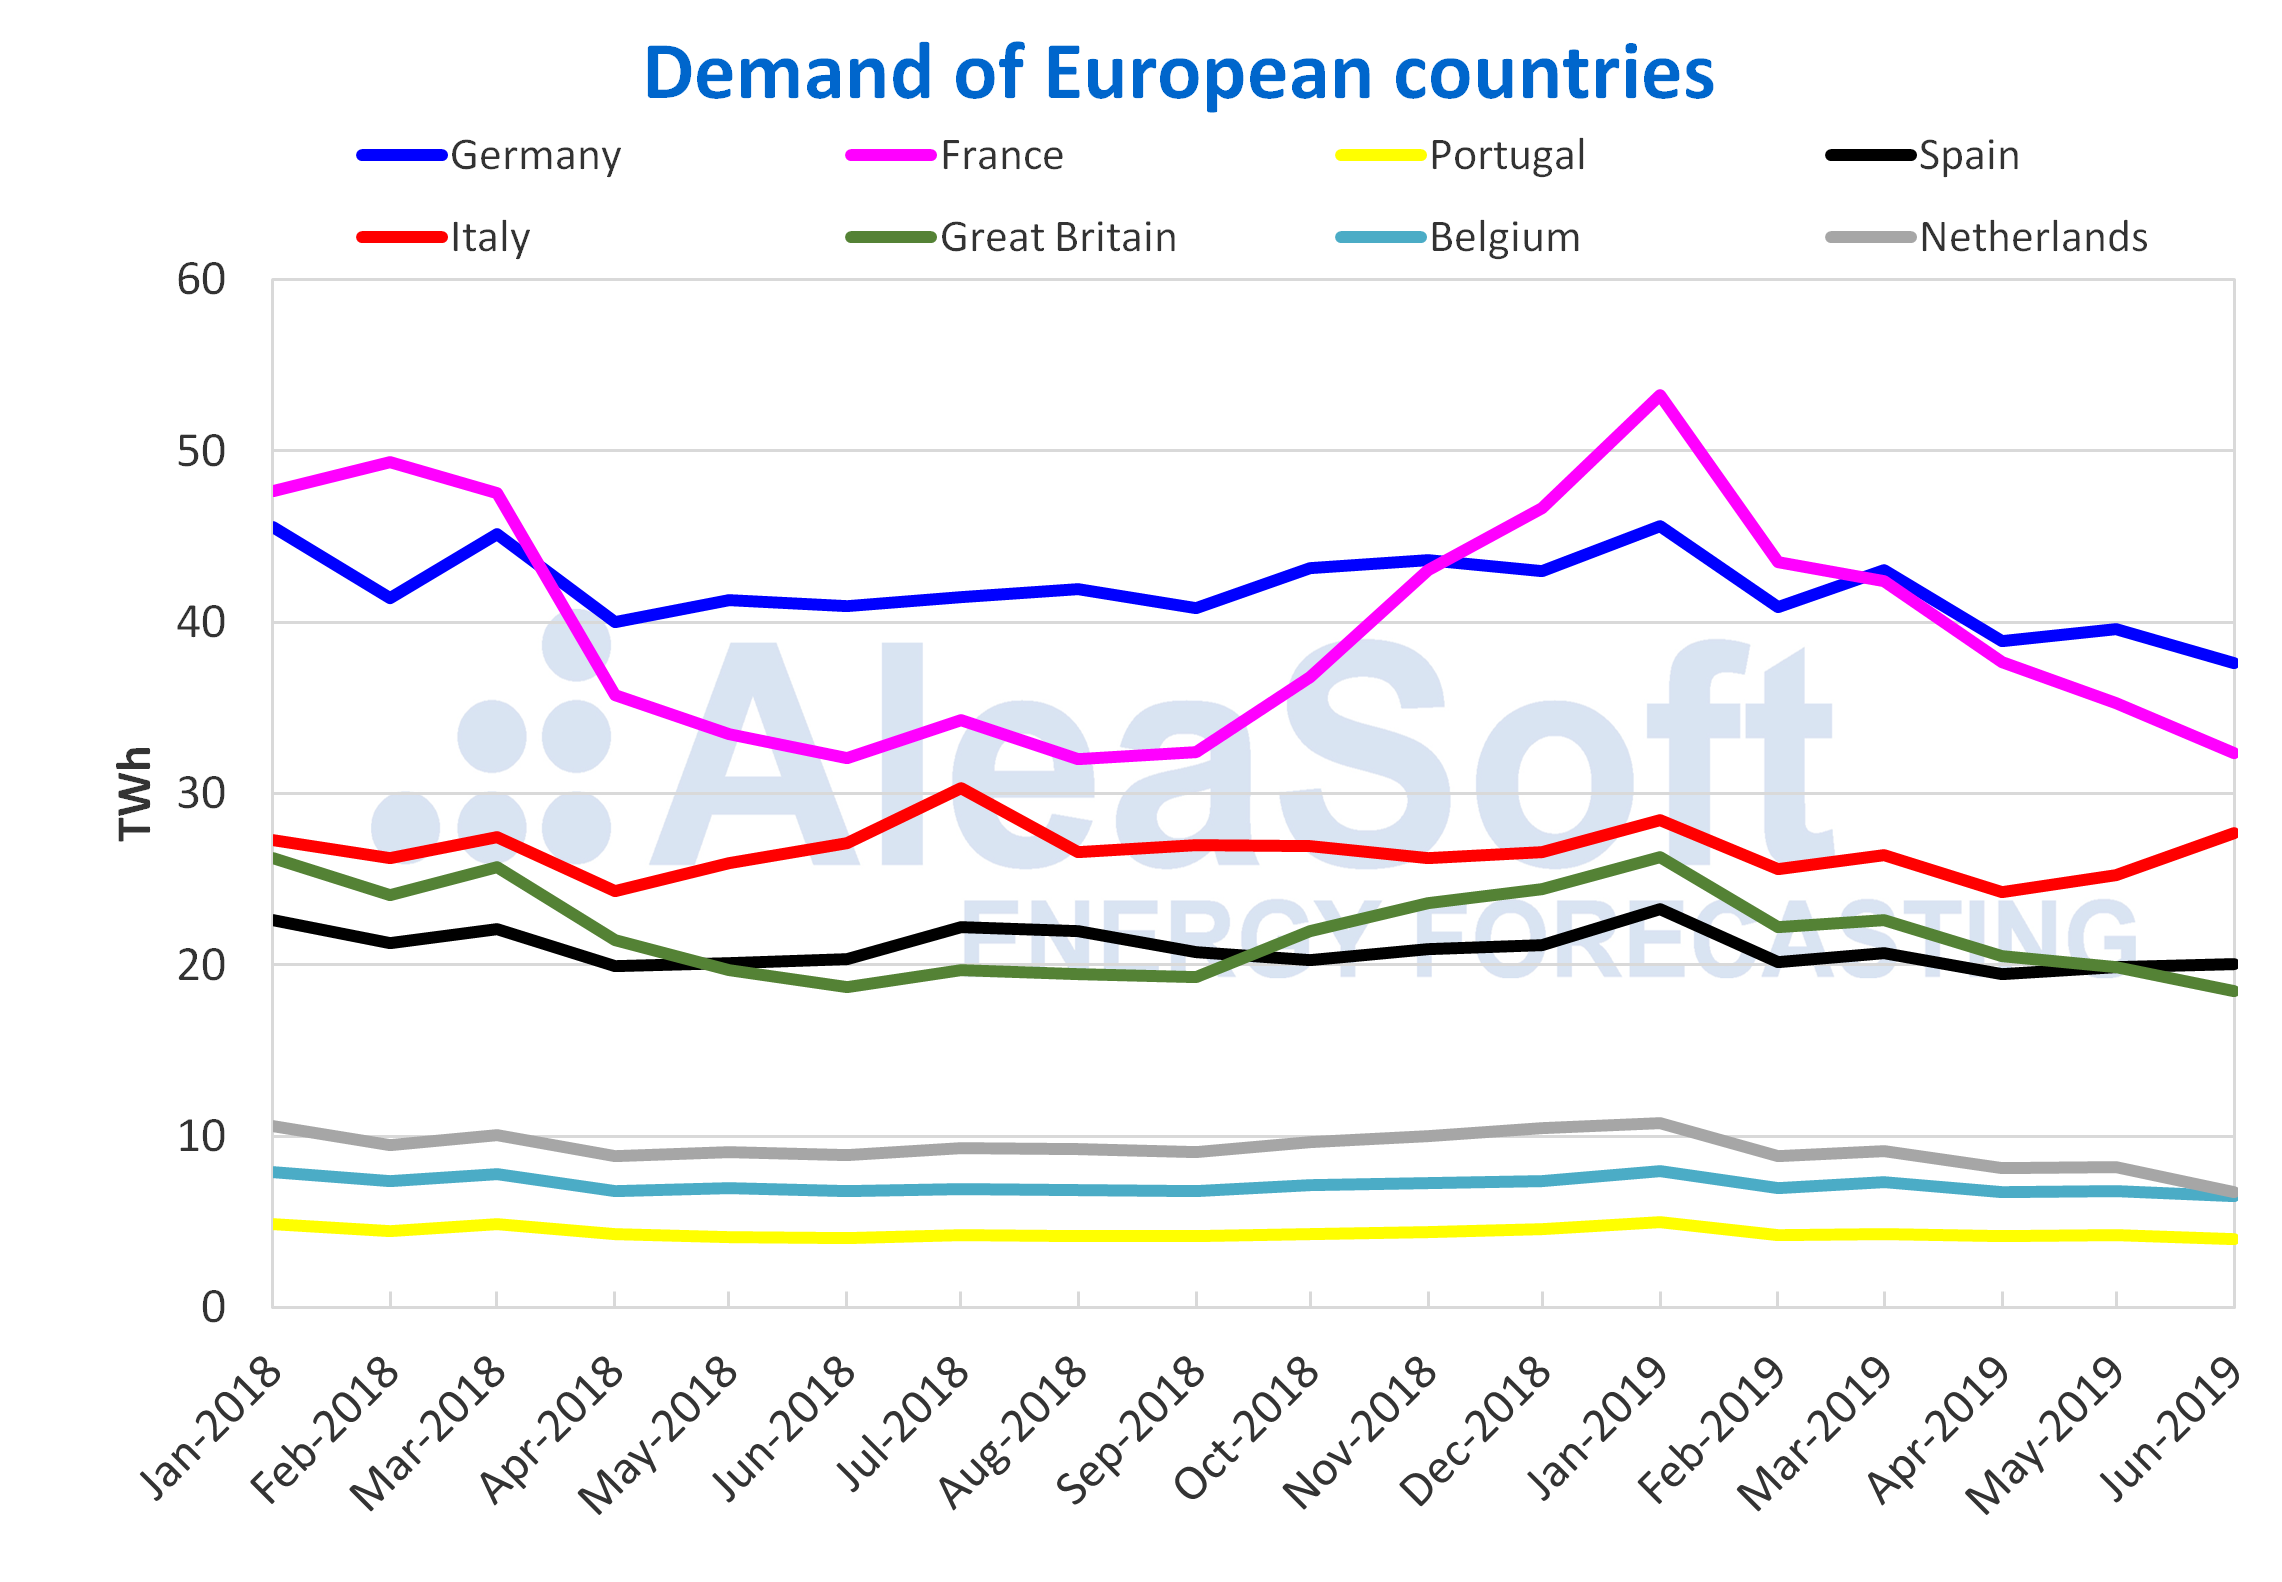
Sources: Prepared by AleaSoft using data from ENTSO-E, RTE, REN, REE, TERNA, National Grid and Elia.
Wind and solar energy production
Wind energy production increased in all analyzed European markets for the quarter just ended, in year-on-year terms. In ascending order, the increases were 10%, 17%, 21%, and 27%, in Germany, Italy, the Iberian peninsula and France, respectively. However, when compared to the first quarter, wind energy production decreased in Germany and Italy by 40%, in France by 30%, in Spain by 15% and in Portugal by 4%.
Making a year-on-year analysis of the half-year that ended on Sunday, it is observed European wind energy production increased by 12% in France, 16% in Italy and 19% in Germany. On the other hand, there was a decrease in production in Spain of 3.8%, and in Portugal of 7.2%.

Sources: Prepared by AleaSoft using data from ENTSO-E, RTE, REN, REE and TERNA.
Solar energy production – PV and solar thermal – increased in year-on-year terms in the last quarter in Germany by 3.6% and in Spain by 22%. In Italy it decreased 1.1%. The production of those three countries increased on the previous quarter, with the most significant increase seen in Germany, with 181%. In Spain, the increase was 56% and in Italy 51%.
Solar energy production in the half-year from January to June, compared to the same period of last year, grew 7% in Germany, 27% in Spain and 13% in Italy.
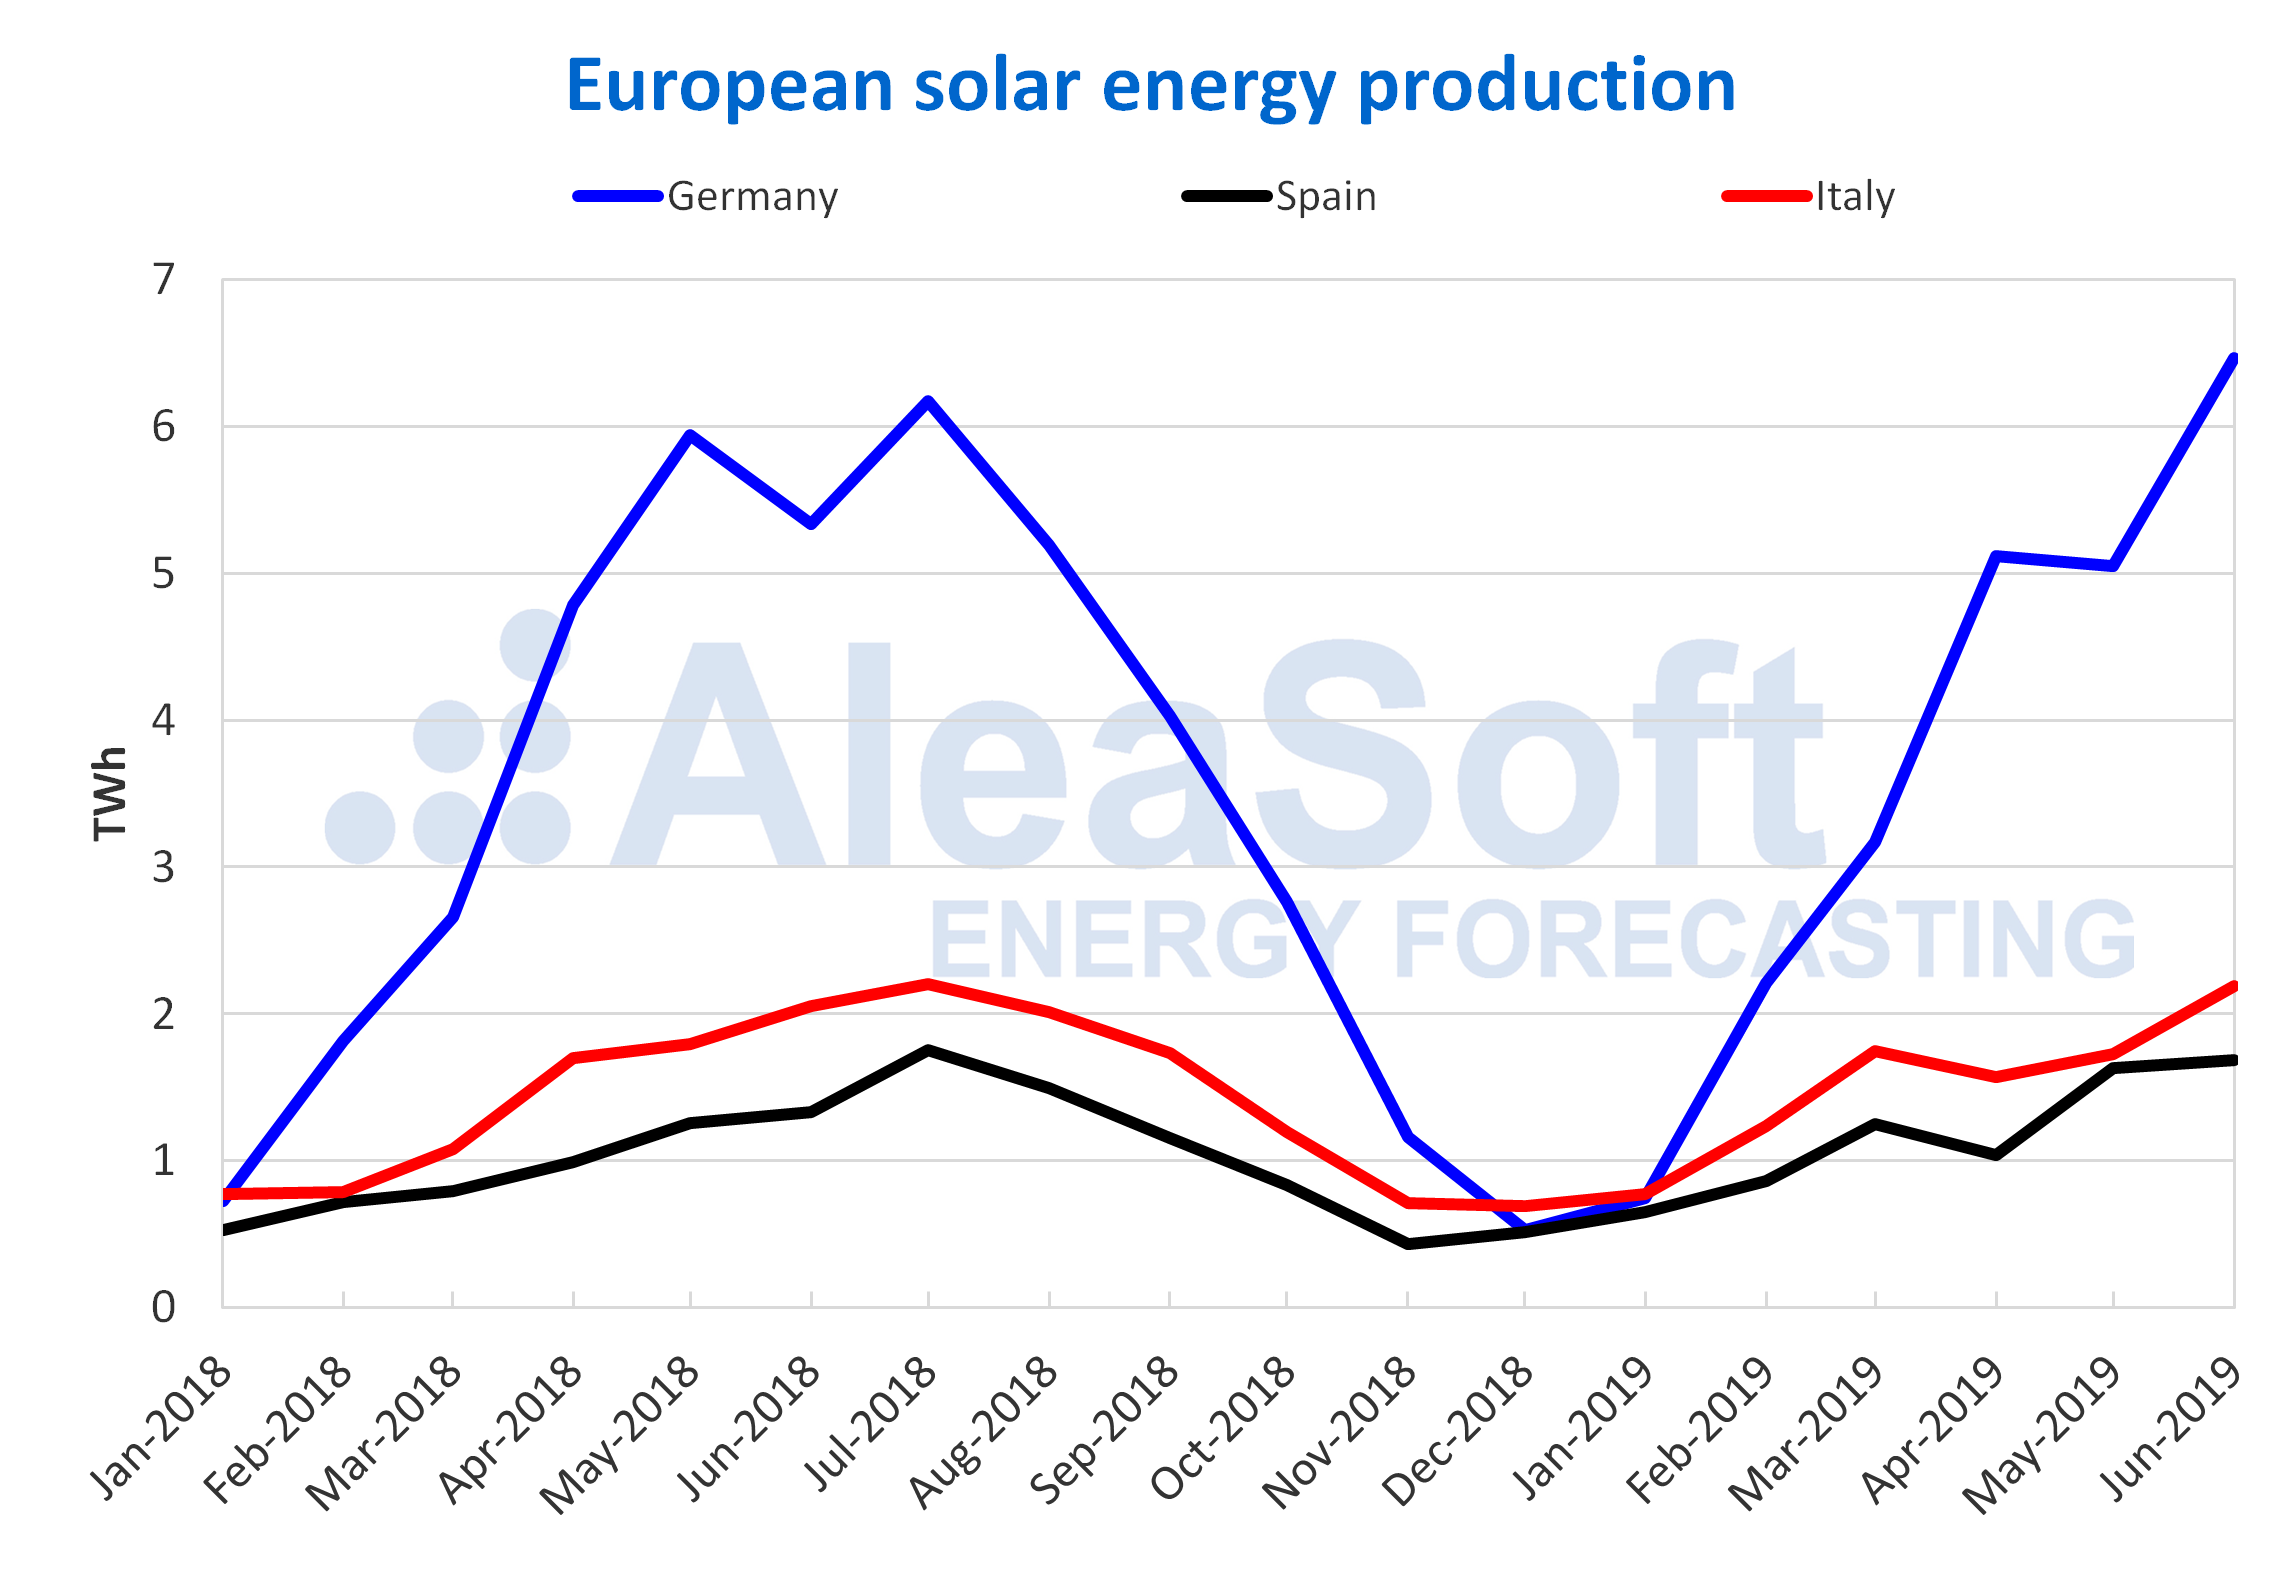
Sources: Prepared by AleaSoft using data from ENTSO-E, REE y TERNA.
