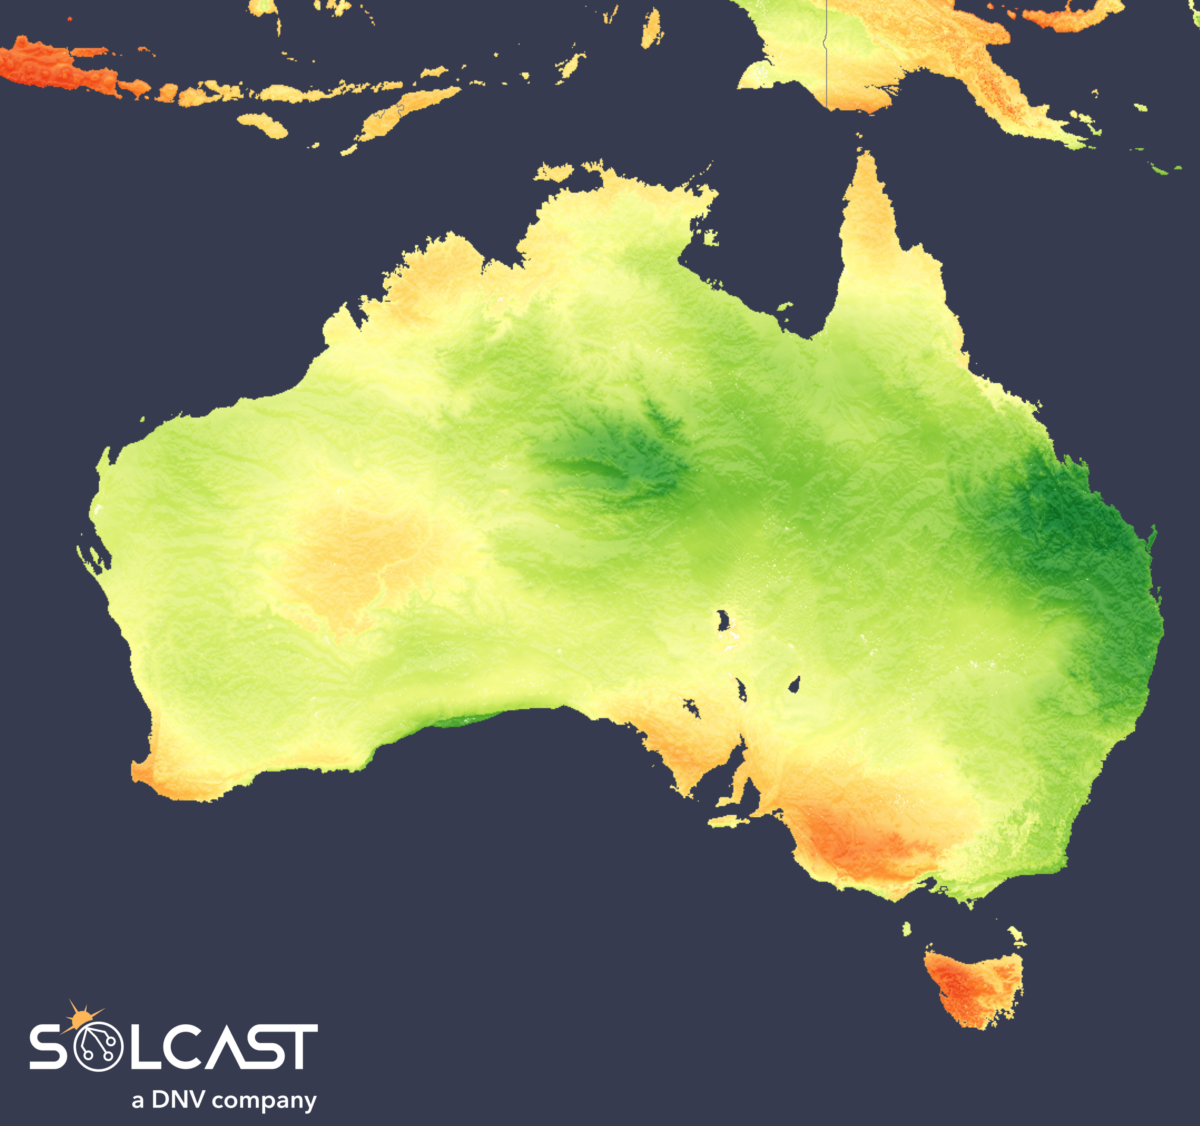
Despite the developing El Nino, eastern Australia’s behind-the-meter normalized generation is down 10% to 15% compared to last year. This development is a result due to a wet and cloudy end to spring, which countered the typical drier, sunny conditions associated with El Nino.
![]()
Using the Solcast API to model behind-the-meter generation at thousands of points, recent data analysis shows how November 2023 rooftop solar performed across the country, compared to 2022.
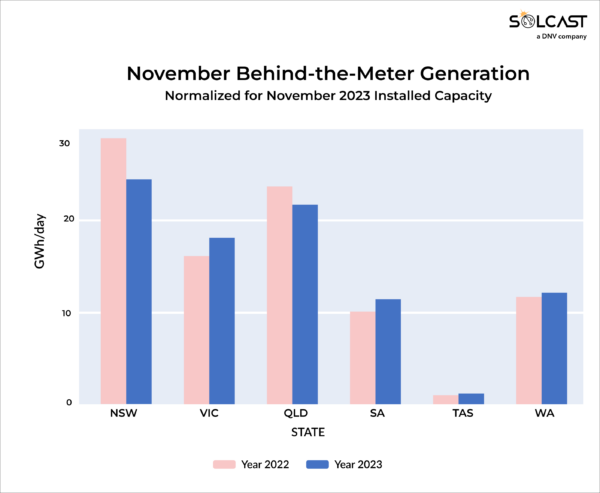
Most solar assets on Australia's east coast underperformed due to cloudier conditions through November. In New South Wales, behind-the-meter normalized generation fell 15% from 2022. Queensland experienced a smaller decrease of about 10%.
These reductions were largely due to persistent high pressure in the Tasman Sea, which directed north-easterly winds into eastern Australia, leading to a more moist and unstable air mass. As a result, November experienced increased storm activity and cloudiness, particularly affecting coastal areas where the majority of residential and commercial-industrial solar systems are located.
In contrast, Victoria experienced a 10% increase in November's year-on-year normalized behind-the-meter generation. This was primarily due to the same high-pressure system in the Tasman Sea suppressing surface cold fronts that affect the west of the state. Cold fronts usually bring south-westerly winds and a cool, moist air mass from the Southern Ocean to western Victoria.
However, their suppression this year led to sunnier conditions, particularly in the west, which includes Melbourne – a high residential PV-density population center. Despite the eastern part of Victoria experiencing about 10% lower irradiance similar to the rest of the east coast, the sunnier west compensated for this in terms of behind-the-meter generation.
Despite its large area, behind-the-meter PV in Australia is highly concentrated due to its highly urbanized and densely populated regions. Australia has the highest per-capita PV installed capacity in the world, growing at a rate of more than 10% annually. Recent data from SunWiz shows that over 330 MW of new rooftop solar systems were installed in November 2023, the largest month for rooftop solar installations ever seen in Australia.
Australia’s high concentration of solar power presents challenges in managing uncertainty in behind-the-meter generation and underlying demand. In multiple states, daytime peaks of rooftop solar generation are pushing demand below base load generation from coal. Accurate solar data and forecasting, like has been used in this analysis, are critical in addressing these challenges, ensuring efficient grid operation and maximizing the benefits of solar energy.
Solcast produces these figures by tracking clouds and aerosols at 1-2km resolution globally, using satellite data and proprietary AI/ML algorithms. This data is used to drive irradiance models, enabling Solcast to calculate irradiance at high resolution, with typical bias of less than 2%, and also cloud-tracking forecasts. This information is used by more than 300 companies managing over 150 GW of solar assets throughout the world.
The views and opinions expressed in this article are the author’s own, and do not necessarily reflect those held by pv magazine.
This content is protected by copyright and may not be reused. If you want to cooperate with us and would like to reuse some of our content, please contact: editors@pv-magazine.com.

By submitting this form you agree to pv magazine using your data for the purposes of publishing your comment.
Your personal data will only be disclosed or otherwise transmitted to third parties for the purposes of spam filtering or if this is necessary for technical maintenance of the website. Any other transfer to third parties will not take place unless this is justified on the basis of applicable data protection regulations or if pv magazine is legally obliged to do so.
You may revoke this consent at any time with effect for the future, in which case your personal data will be deleted immediately. Otherwise, your data will be deleted if pv magazine has processed your request or the purpose of data storage is fulfilled.
Further information on data privacy can be found in our Data Protection Policy.