Australia's solar fleet, concentrated in the populated southeast and southwest regions, bucked a national trend to perform well during March. The analysis, compiled using the Solcast API, includes forecasts for the last two days of March and showed that rooftop and utility-scale solar performed well due to above-normal irradiance over the installed solar of the National Electricity Market (NEM) of the southeast, and the South West Interconnected System (SWIS) of the southwest. The over-performing solar regions for March compared to normal were Victoria (15% above), followed by Tasmania (11% above), Western Australia's SWIS (10% above), and New South Wales (6% above).
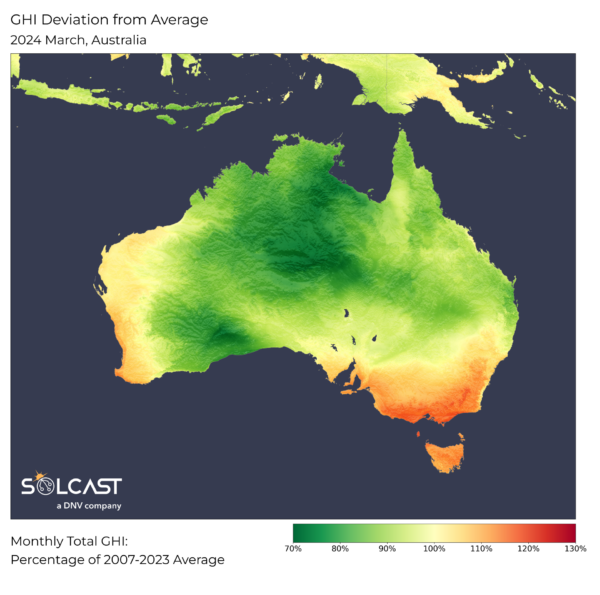
This overperformance in the southeast and southwest came despite most of the Australian continent seeing below-average irradiance, due to thicker-than-usual clouds over the sparsely-populated interior and tropics. Solar performance in Queensland and the Northern Territory was down 10% to 30% below normal for March.
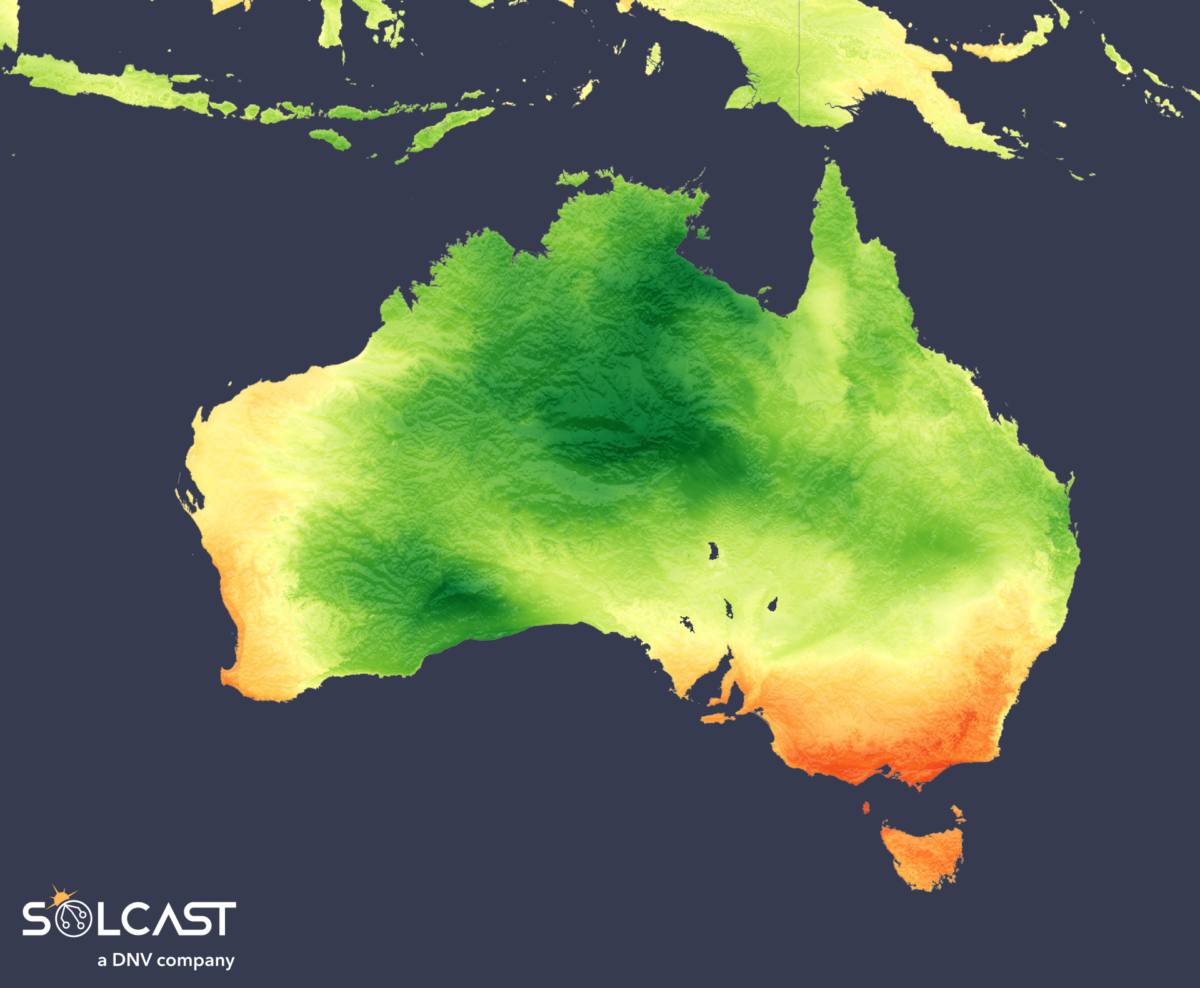
The cause of the pattern of above and below normal irradiance during March was a predominant weather pattern of high pressure off the east and south coasts of Australia, and monsoonal low pressure over the inland and northern tropics. This pattern resulted in more cloud over the tropics and inland, and in prevailing northeasterly winds – making Queensland cloudy but drying air over the other populated areas of the southeast and southwest.
The data, which Solcast creates using satellite data calibrated to ground measurements, showed that the contrast was so stark that farmland solar zones in New South Wales and Victoria received more total irradiation for the month than Australia's “Red Centre” inland deserts received.
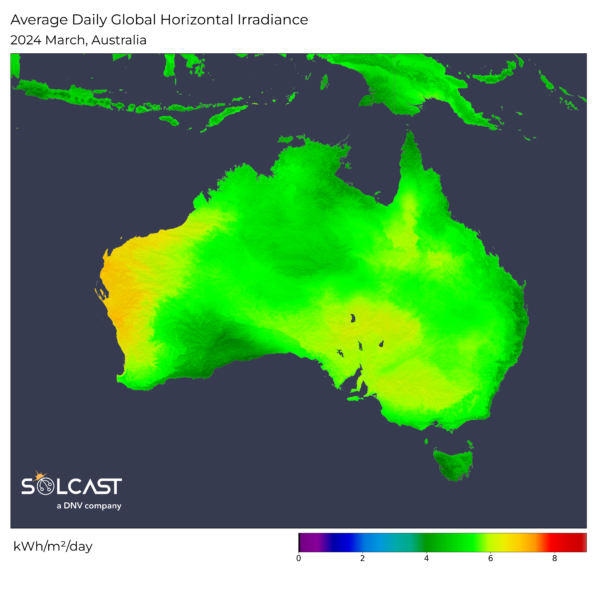
Solcast produces these figures by tracking clouds and aerosols at 1-2km resolution globally, using satellite data and proprietary AI/ML algorithms. This data is used to drive irradiance models, enabling Solcast to calculate irradiance at high resolution, with typical bias of less than 2%, and also cloud-tracking forecasts. This data is used by more than 300 companies managing over 150GW of solar assets globally.
The views and opinions expressed in this article are the author’s own, and do not necessarily reflect those held by pv magazine.
This content is protected by copyright and may not be reused. If you want to cooperate with us and would like to reuse some of our content, please contact: editors@pv-magazine.com.


5 comments
By submitting this form you agree to pv magazine using your data for the purposes of publishing your comment.
Your personal data will only be disclosed or otherwise transmitted to third parties for the purposes of spam filtering or if this is necessary for technical maintenance of the website. Any other transfer to third parties will not take place unless this is justified on the basis of applicable data protection regulations or if pv magazine is legally obliged to do so.
You may revoke this consent at any time with effect for the future, in which case your personal data will be deleted immediately. Otherwise, your data will be deleted if pv magazine has processed your request or the purpose of data storage is fulfilled.
Further information on data privacy can be found in our Data Protection Policy.