March was marked by unusually wet and unseasonal conditions across most of Australia, as record-breaking tropical cyclone activity and polar air intrusions disrupted typical early autumn weather patterns.
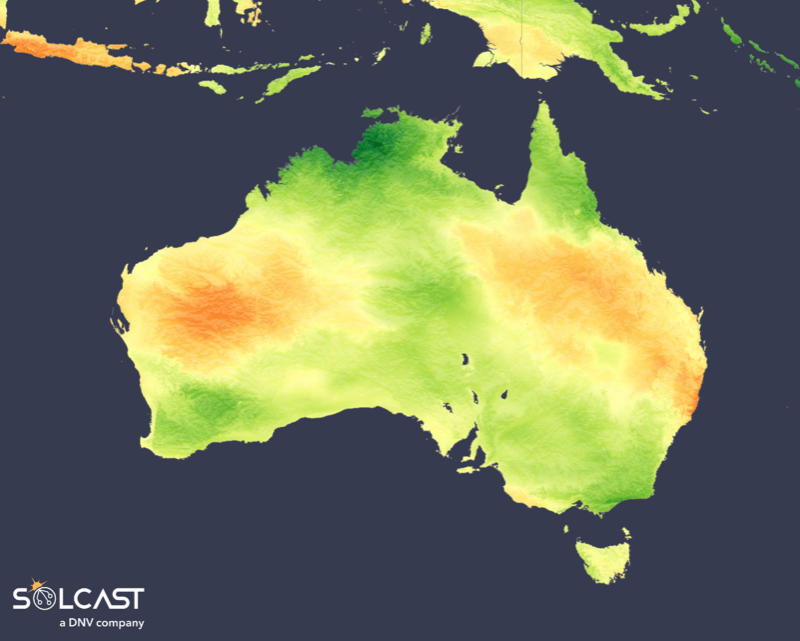
Australia recorded mixed irradiance conditions through the month, with below-average irradiance across the south, and far north, stronger performance along the north west and north east coasts, and a late-month deterioration in the south driven by unseasonably cold weather and storm activity, according to analysis using the Solcast API. Persistent cloud suppressed solar resource inland, while coastal regions benefited from clearer breaks between weather systems. Short-lived aerosol impacts linked to cyclone activity briefly reduced irradiance, while a sequence of lows across month weighed heavily on southern regions.

Across southern Australia, irradiance trended below average for much of the month. While no single system dominated conditions, repeated cloudy periods limited irradiance . This type of repeated cloud reduces irradiance evenly over time, producing a clear negative signal when conditions are aggregated across the month.
In contrast, both the central east and west coasts experienced higher-than-normal irradiance overall. These regions were impacted by several cyclones and convective storm systems; however, clearer conditions between systems allowed irradiance levels to recover quickly, offsetting short-term reductions. As a result, monthly averages remained elevated despite periods of unsettled weather.
A visually striking feature of the month was the appearance of red skies across parts of Australia, caused by dust kicked up by Cyclone Narelle and enhanced the cyclone’s cloudy conditions.
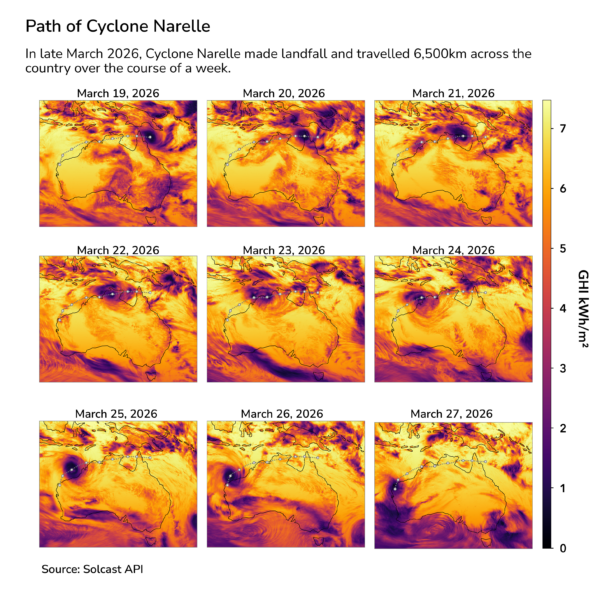
Strong winds ahead of the system mobilised iron-oxide-rich desert soils, colouring the sky as the cyclone tracked toward the North West Cape.
Narelle was particularly notable for both its intensity and its trajectory. The system first made landfall in Queensland before travelling westward along the northern coastline, impacting the Northern Territory and Western Australia. In doing so, it became the first cyclone since 2005 to make landfall across three Australian states and territories, travelling an approximate 6,500 kilometres during its lifespan. The unusually long-lived nature of the system meant it delivered flooding and damage to a number of northern regions.
While cyclone activity influenced conditions in the west and north, another striking weather pattern developed in the south-east of the country. Strong polar winds drew cold air northward, bringing unseasonably low temperatures across Victoria, New South Wales, and Tasmania. Decade-long temperature records were broken in several locations, producing Australia’s first snowfall of 2026 and signalling an unusually early seasonal transition.
These polar winds contributed to the development of a low-pressure system in the Tasman Sea, driving more cloudy, windy, and rainy conditions across south-eastern Australia. The resulting cloud cover reduced irradiance below normal levels during the latter part of March, particularly across regions with a high concentration of installed solar capacity.
This system marked the culmination of a broader sequence of low-pressure systems that affected south-eastern Australia through late February and March. An earlier system crossing South Australia and New South Wales delivered heavy rainfall and cloud in late February, followed by a mid-March trough that travelled down the New South Wales coast, again bringing storms and widespread cloud. Given the density of solar generation along the eastern seaboard, this sequence of systems is likely to have had an outsized impact on Australia’s solar generation relative to their spatial footprint
Solcast produces these figures by tracking clouds and aerosols at 1-2km resolution globally, using satellite data and proprietary AI/ML algorithms. This data is used to drive irradiance models, enabling Solcast to calculate irradiance at high resolution, with typical bias of less than 2%, and also cloud-tracking forecasts. This data is used by more than 350 companies managing over 350 GW of solar assets globally.
The views and opinions expressed in this article are the author’s own, and do not necessarily reflect those held by pv magazine.
This content is protected by copyright and may not be reused. If you want to cooperate with us and would like to reuse some of our content, please contact: editors@pv-magazine.com.


By submitting this form you agree to pv magazine using your data for the purposes of publishing your comment.
Your personal data will only be disclosed or otherwise transmitted to third parties for the purposes of spam filtering or if this is necessary for technical maintenance of the website. Any other transfer to third parties will not take place unless this is justified on the basis of applicable data protection regulations or if pv magazine is legally obliged to do so.
You may revoke this consent at any time with effect for the future, in which case your personal data will be deleted immediately. Otherwise, your data will be deleted if pv magazine has processed your request or the purpose of data storage is fulfilled.
Further information on data privacy can be found in our Data Protection Policy.