The importance of testing in the PV industry is enormous. All sorts of products are tested in global manufacturing, but the main driver behind PV testing is the pressing need to secure revenues for 20-25 years. The application of PV testing ranges from inline production testing, to limited batch testing of finished products, to certification testing, and finally to extended reliability testing. These levels of testing can cost from very little to tens of thousands of USD, and take from a few hours to a few months. PV testing is mostly carried out as independent testing, as the sector is too dynamic, and the stakes are too high, to leave it entirely to the manufacturers.
There have been attempts in the past to run such benchmarking tests, but their complexity and high cost exceeded the current needs of the market. Clearly, the pv magazine test does not waive the necessity for reliability testing and 3rd party quality assurance oversight. Its main function is to present a public benchmarking platform for new products and companies, leveraging the wide reach of pv magazine’s readership. Our approach in the pv magazine testing project was to create a basic level of testing, focusing on certain key module performance and reliability indicators, that would enable us to do a benchmark comparison of products.
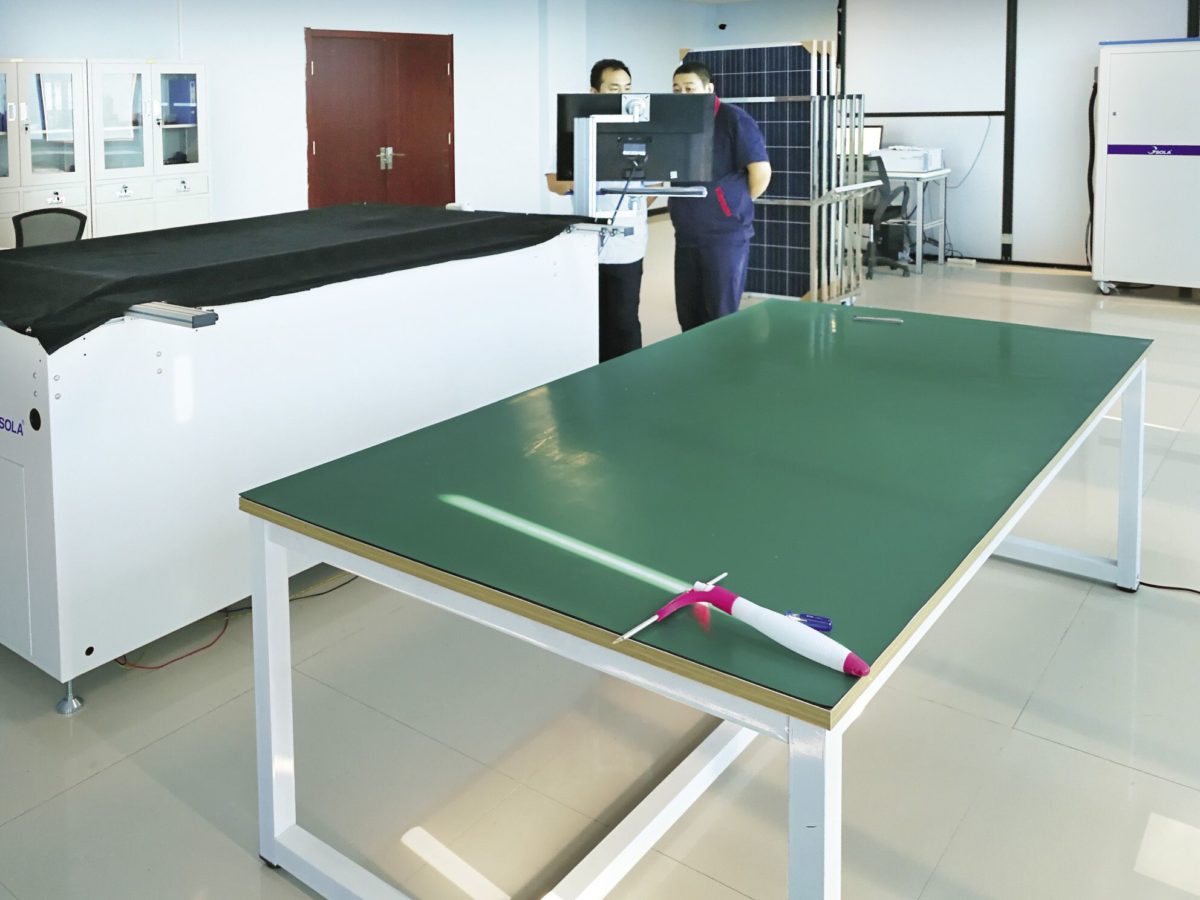
The three parties in this testing program combine their respective expertise and outreach in the PV industry in an optimal manner. pv magazine is the top solar PV information platform, with a very wide audience and extended network within the manufacturers. Gsolar is a leading Chinese equipment manufacturer, with expertise in power measurement and EL imaging tools. And CEA is a global leader in providing technical advisory, quality assurance, and independent engineering solutions for the PV industry worldwide.
The tests
The values that guided our team in designing the testing program were simplicity, relevance, and transparency. Our focus is on two distinct aspects of PV modules: performance and reliability. The testing program flowchart on p.90-91 lists the tests and procedures in full detail. The table on p.89 lists all the tests, their values, the methods used and the grades that can be assigned.
The selection of the tests was such that key performance indicators were included:
Low Irradiance Efficiency
The specific electrical properties of PV modules do not necessarily allow them to have the same efficiency in low irradiance conditions. The power of a module is tested at the Standard Test Conditions (STC), at an irradiance of 1,000 W/m², cell temperature of 25 °C, and a spectrum of 1.5 AM (Air Mass). In locations where the sun does not shine bright for most of the time, the typical irradiances are much lower than 1,000 W/m². This test measures the relative efficiency loss at an irradiance of 200 W/m², which is what you would get on a cloudy day in northern Europe. A module with low losses at low irradiance, would also start producing earlier in the day and stop later than one with higher losses. Buyers who want to install solar modules in low light parts of the world should carefully look at this performance indicator, as it may lead to up to a few percentage points of difference in energy yield.
Pmax Temperature Coefficient
As the module heats up and its temperature rises to several tens of degrees Celsius (up to 70°C or even more), its efficiency drops steeply. This is a linear dependency and the Pmax Temperature Coefficient is the respective module parameter that enables engineers to predict the module energy yield according to the temperature profiles. A PV module with a “steep” temperature coefficient (high absolute value) will produce less energy in hot climates, up to several percentage points less, compared to a module with a “flatter” dependency (low absolute value). Thin film panels are well known to “beat” crystalline silicon modules in hot climates, because of their superior performance at high temperatures, due to their “flat” temperature dependence. Modules using heterojunction crystalline silicon cells (HIT or HJT), can have similar or better to thin film Pmax temperature coefficients, and we see an industry drive to solve the cost and technical issues that hold them back and bring mass adoption. However, mainstream crystalline silicon PV modules remain the prime choice, and we see the temperature coefficients steadily improving over the years. When selecting modules for very hot climates, buyers must look very carefully at this parameter.
Outdoor monitoring of energy yield
This is the single “real world” performance indicator that every buyer is most interested in. However, planet earth has a wide variety of climate profiles, and, by necessity, we had to choose just one: that of Xi’an, where Gsolar has prepared an outdoor installation field. Xi’an has a temperate climate, with cold winters and mildly humid, hot summers. Each product will be monitored over a 12-month period, and its energy yield (kWh/kWp) will be monitored and measured. Dedicated areas have also been designed for the monitoring of bifacial modules. The results will be presented when the data collection has reached a certain point of completion.
Reliability is arguably the most important aspect of a PV module, so our tests put special focus on characterizing the tested products in several ways:
Visual inspection
It is said that all modules look the same, but there are big differences in the overall visual appearance of modules, that are intrinsically linked to the general level of the production quality at the factory. CEA has inspected many GW of PV modules in factories globally, and has developed a proprietary Visual and EL defect classification system, that classifies and assigns a risk score to each defect that is found, depending on the potential of the specific defect to cause module failure. For example, cosmetic defects, such as frame scratches, carry a lower risk score than glass or backsheet scratches, which have a higher potential to cause failure through glass breakage and backsheet disintegration respectively. The tested product samples are carefully examined against a list of over 40 different defect classes, and a general score is created, according to the number and the severity of the defects in CEA’s system. Buyers must be very attentive to this indicator, because, even if the product itself has passed the standard certification or even extended reliability tests, substandard production processes may compromise its ability to withstand the outdoor stresses.
EL image inspection
PV module EL (electro-luminescence) imaging is a very well established inline and offline method to characterize PV modules. The presence of EL defects usually means that the electrical properties of the module are problematic. Some EL defects, such as “broken fingers” do not pose reliability concerns, if their extent is limited, but other EL defects such as “bad soldering” or “microcracks” may pose a very severe risk of future failure. It is important to stress that a module with, even severe, EL defects may not necessarily exhibit power loss, but it will certainly do so at some point in the future. The screening of EL defects is thus a method to avoid future problems. The PV industry has developed widely accepted practices to judge EL defects, and CEA has adopted the best practices in its proprietary defect classification system. An excessive number of EL defects usually means that the manufacturer has substandard methods of screening out low-grade modules. In a similar way to the visual inspection, buyers will look at the results of this test with great attention to avoid quality pitfalls.
However, it must be stressed that the implementation of a robust, 3rd party production oversight program on the production floor can limit the risk of having too many visual or EL defects. In short, if the manufacturers have good products, that have done well during lab testing, they can be guided to produce them in big volumes at the right quality, and can screen out the lower grade modules.
PID test
Potential Induced Degradation (PID) has become one of the biggest headaches for asset owners and module manufacturers in recent years. CEA, in its capacity as technical advisor, has witnessed many instances of protracted warranty claims or lengthy pre-production negotiations on PID test conditions. The plain truth is that although PID is very well studied and there are well known processes to almost fully mitigate PID risk at the production stage, the PV industry is under immense pressure and operates with razor thin margins at most times. Moreover, it’s no secret that there is no such thing as a “PID free” module. The new IEC standard for PID testing employs an entry level approach to test conditions, whereas it is well known that manufacturers test internally at much stricter conditions. Our approach was to use strict conditions and test at 85% relative humidity and 85 °C, instead of 60 °C. The IEC PID test standard pass/fail threshold is at 5% of power loss, which is a very substantial figure that no investor would like to experience. In our PID test, we employ grades rather than pass/fail criteria. Depending on the location, with humidity, heat, ungrounded inverters and proximity to the sea being major factors affecting PID, a module buyer can use the PID test results to intelligently select a product that best fits the application.
LID test
The Light Induced Degradation (LID) test is optional in pv magazine’s testing program. The reasons for this are: 1) LID is not a major concern for standard cell architectures, or n-type cells and 2) it is a more “complex” test, requiring onsite sample selection by CEA at the factory floor, to ensure that no light soaking is applied on the samples, which would compromise the test result. At this stage, no LID testing was done on the 1st batch of the products. However, it is known that PERC cells, especially multi-PERC, can suffer from excessive LID, if special processes are not applied at the ingot or cell stage. We expect to see more manufacturers opting for LID testing, as PERC modules become more common.
The grading system
pv magazine test is a benchmarking program, and as such, we need to employ grades, besides listing the actual test results. There are 5 grades, A+/A/B/C/D, according to the test value ranges referenced in the table on p.92. The grading ranges were selected by drawing on CEA’s deep knowledge of best industry practices, and with a view towards future improvements. In this sense, the grades may seem “strict” now, but new products, with new, improved technologies will have room to show their superiority, and a “top grade” congestion will be avoided.
It is worth keeping in mind that the grades mainly serve to give a quick benchmarking overview of the results, but the actual test results are referenced for the reader, offering a more granular view of the tested products. An average product grade, which is a weighted average of all tests, is finally given to each product. The LID grade, being an optional test, is not included in this grade. The individual test grade weights have been chosen according to the importance of each test to the overall quality. Please see the grading weights in the table above. Visual and EL test grades were only given a 10% weighting each, as the effect of a low grade in both tests can be mitigated by doing third party onsite quality assurance. On the other hand, PID was given the highest 30% weight, as it is a major concern for buyers globally.
The test procedure
The first batch of pv magazine testing included four products, submitted by four manufacturers: Jolywood, Risen, Perlight and a manufacturer who decided to remain anonymous.
Jolywood submitted an advanced module design for testing, a bifacial, n-PERT, glass/glass module. The test reports, including the test results, grading and relevant documentation were submitted to the manufactures for their approval before publication. Jolywood approved the full publication of the results and individual test grades, whereas Risen and Perlight only approved the publication of the average product grades, without the publication of individual test results.
The manufacturers have this choice because they can opt for a second round of testing and improve their performance. The detailed results of Jolywood’s test, and the average product grades of Risen and Perlight are listed below.
Finally, the fourth manufacturer decided to improve its product and attempt a second testing at a later stage, without publishing any results, or its name for now. Upon completion of the second test round, test results will be published in their entirety.
Random sample selection
As you can see in the testing program flowchart (p.90-91), great care was taken in ensuring the test samples were chosen at random. In the very first step of the process, each manufacturer submitted 2,000 serial numbers, from which five samples were randomly selected by CEA’s engineers.
The manufacturer was given the five serial numbers to pick out, and was then obliged to submit the factory EL images of the samples to CEA within two hours.
The EL images serve as module “fingerprints”, as each image contains crystal patterns which are unique for each individual module. This practice is designed to ensure that no module substitution occurs, and a level playing field exists for all participants.
All of the manufacturers received detailed checklists with instructions well in advance of the selection, so there were no serious problems or delays in receiving the requested serial numbers and EL images.
Packaging and shipping
Module transportation may cause cell microcracks or even module deformation in severe cases. Special wooden boxes were specified, with G-shock stickers of an appropriate rating attached to them.
When the samples arrived at the test lab, the condition of the packages and G-shock stickers was checked and documented, so that any abnormal transportation damage to the samples could be excluded. No transportation damages were observed during this phase.
Visual and EL inspection
All 5 samples of each product were subjected to visual and EL inspection. All defects were classified according to CEA’s proprietary system, and pictures were taken and recorded. Besides inspecting for EL defects, the EL images were also used to verify the identity of the samples, by comparing them with the factory EL images collected during the initial random selection.
All of the sample identities were verified correctly. During inspection, some products were found to have no defects at all, but some had visual defects, such as cell scratches. This again proves the power of the random selection, as it is very improbable that a manufacturer would have allowed this sample to be shipped on their own initiative. For a certain product, we observed an excessive number of microcracks, that did not appear in the original factory EL images. There are 2 probable causes for this: a) the modules were transported and damaged inside the factory, prior to packaging, or b) the cells were too fragile to withstand normal transportation stresses.
Jolywood’s product scored a C grade during visual inspection, with two visual defects found. The EL score for Jolywood was A+, as no EL defects were discovered.
Pmax STC measurement
All samples were inserted into the sun simulator, and their Pmax STC values were measured. The pre-test values were used in the subsequent tests. For Jolywood’s bifacial module, the rear side was also measured, and the bifaciality ratio was calculated. This ratio was derived by measuring the front and rear side Pmax STC values, and dividing the rear by the front value. The average bifaciality ratio for Jolywood was 86.45%.
Low Irradiance Efficiency test
One sample of each product was inserted in the flatbed sun simulator and tested at 200 W/m². One product showed instead a positive efficiency gain at low irradiance, but another lost above 5%. Jolywood’s product lost only 0.11% of efficiency and scored a very good A.
Pmax Temperature Coefficient
One sample of each product was inserted in the specially modified flatbed sun simulator, equipped with a thermal stabilization box and an auto-trigger infrared thermometer. The overall results ranged from A to D.
Jolywood’s product measured a very good -0.39%/°C, and scored a B grade, being however very close to the A grade threshold.
PID test
One sample of each product was inserted into the PID chamber, where it stayed for 96 hours under conditions of 85% relative humidity, 85°C, and under bias at -1,000V. PID grades were generally good, ranging from A to B.
Jolywood’s PID loss was a very low 0.48%, and A grade. This is quite expected, since glass/glass modules are inherently very resistant to PID. Please note that this grade applies only for 1,000V systems, and another test result will be published in an upcoming issue after the 1,500V PID test is completed.
Overall grades
Individual test ratings for the Jolywood JW-D60N appear in the graph on p.92, ranging from A+ for EL inspection, to C for visual inspection.
Conclusion
As expected, our tight selection method and strict grade limits produced results that had a wide range and diversity, depending on the individual tests. We avoided top-grade congestion, and left plenty of room for improvement for the manufacturers. As pv magazine test develops, and more tests, such as LID, are included, and new data start streaming from the outdoor installations, we expect that more and more manufacturers will submit high quality, innovative products that will further expand the PV quality envelope.
Author: George Touloupas
This content is protected by copyright and may not be reused. If you want to cooperate with us and would like to reuse some of our content, please contact: editors@pv-magazine.com.