After an initial trial period, during which we analyzed the data and solved some technical bugs, the monitoring data started to be collected and recorded in the official test log. The detailed methodology, designed to achieve the best possible accuracy, was described in the June article (pv magazine 06/2018,p. 100), but we decided to take some extra steps to ensure our data were sound.
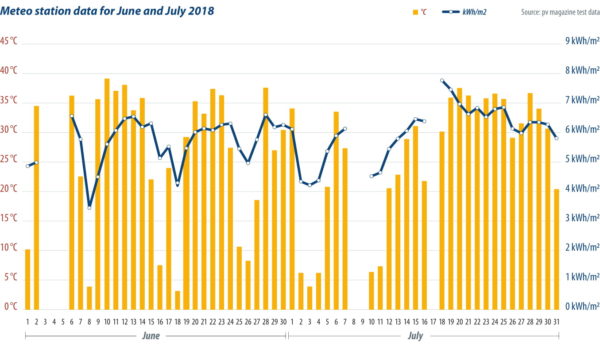
For example, although the meters arrived from the supplier calibrated, sev- eral were sent to an independent lab to check that the factory calibration was good, which it was. We also took the extra step to perform on-site PMAX mea- surements by using a portable I-V tracer. The I-V tracer values were compared with the metered values and were found to be within the equipment tolerance. For the bifacial modules, we performed several measurements of the PMAX of the bifacial products with their back covered, both with the installed meters and the I-V tracer, and compared it with the normal, bifacial operation values, to ensure that our bifacial boost yield data were consistent with these. The meteo station data (irradiance and ambient temperature) and software settings were checked for consistency and adjusted (see graph below).
The gaps in the data are due to power cuts. The data points for these days have been removed from the energy yield data set. Please note that the temperature values correspond to the average ambient temperature during daytime hours. The irradiance values correspond to the total daily irradiance falling on the plane of array of the test field. The meteo station data are currently given purely for informational purposes. At a later stage, after more data are gathered and more products are introduced, the meteo station data will help calculate other performance parameters and study the theoretical modeling of the performance of the modules, based on their characterization test results.
Yield data
The energy yield data for the months of June and July are given in the table below, and the average values for June and July are given in the table on p. 109. Please note that we have installed two additional modules, designated Sample A and Sample B, randomly purchased from the market, so that we can benchmark the results of supplier samples against average modules sourced from the market.
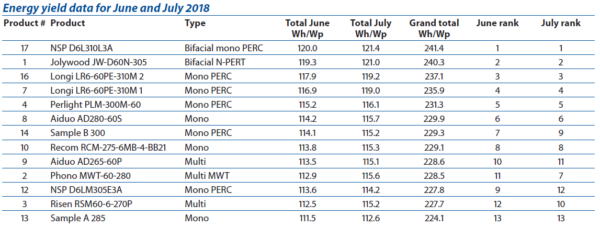
The ranking of each module is shown for June and July. Please note that the first six positions and the last one remain stable, but there are some changes in the lower rankings. However, the yield differences are too small to draw conclusions. We have to observe the data over a longer period of time to extract a more meaningful analysis of these fluctuations.
Energy yield is given in Wh/Wp and calculated by dividing energy produced by the module by the PMAX at standard test conditions (STC). This PMAX is the maximum STC power after a process of stabilization, as explained in detail in the June article, and is lower than the nominal power of the modules. This stabilized PMAX is roughly equivalent to the module power after a few weeks of exposure in the field and after the light-induced degradation effect has stopped developing.
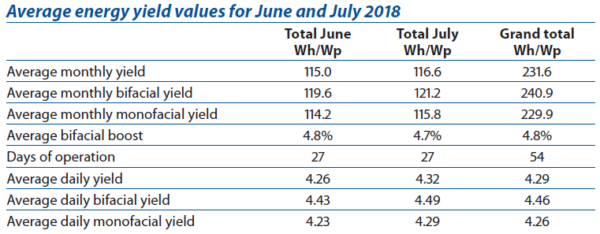
Drawing conclusions
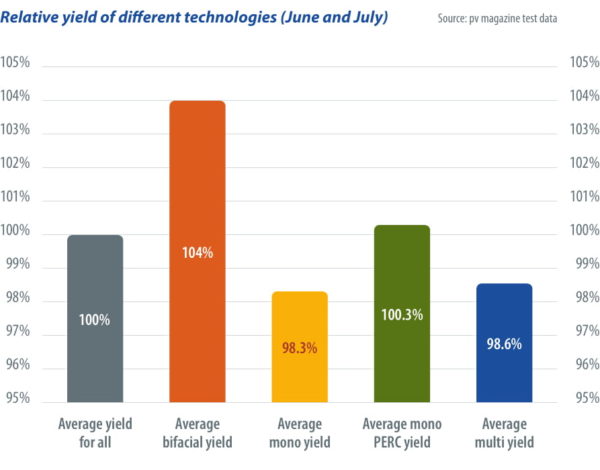
The results below are grouped into categories, per module type, as this helps compare similar products. There are several interesting observations to be made here. As expected, the champions are the two bifacial products from Jolywood and Neo Solar Power. These modules produce about 5% more energy than the average production of all the monofacial modules. The bifacial boost depends on many parameters: the bifaciality factor, the installation geometry, the albedo of the ground, and also the sun angle and diffuse irradiance. The ground in this case is an artifical material simulating grass. Grass normally has an albedo value of about 15%. Although the gain of 5% seems low, it can have a highly complex dependency on the other parameters, so no safe conclusions can be made at this point, until we further investigate the matter.
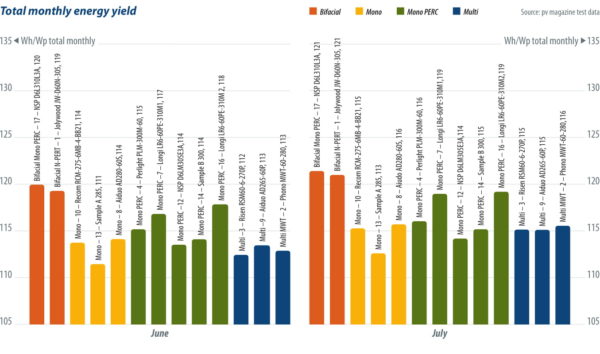
The other notable fact is that the two mono PERC, monofacial samples from LONGi have the next highest energy yield. We are now looking forward to installing LONGi’s bifacial module and measuring its performance shortly. Looking once again at the different types of technology, another obvious conclusion is that PERC is definitely the winner among monofacial technologies. The graph above left shows the different relative energy yields grouped by technology type. Mono and multi, unsurprisingly, have similar performance We are very excited to have delivered the first batch of energy yield data from the outdoor test field in Xi’an. As we install more samples, gather more data points and deepen our analysis, we expect to be able to draw more conclusions and correlations.

This content is protected by copyright and may not be reused. If you want to cooperate with us and would like to reuse some of our content, please contact: editors@pv-magazine.com.