
In June (pv magazine 06/2018, p. 100) and September (09/2018, p. 106), we detailed the field setup and testing methodology, alongside conclusions from the first results.
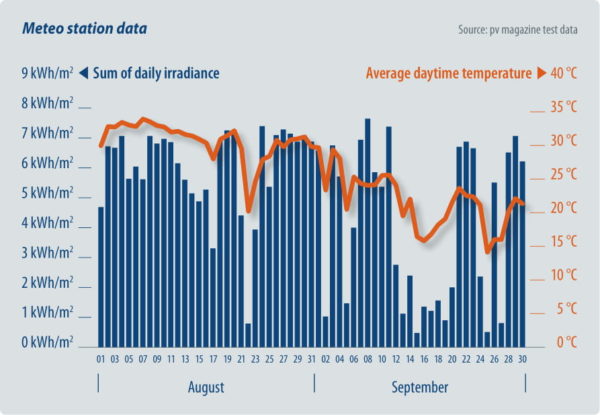
The graph below charts the meteo station data (irradiance and ambient temperature) at the testing site for August and September 2018.
August had the highest irradiance and highest average temperature, and September had unstable weather with many low irradiance days.
Energy yield data for the months from June to September are given in the table below right at the bottom of p. 61, which reveals the dominance of bifacial products as well as their consistency.
The first five ranking positions in each month are marked in bold type. It is interesting to observe the first two positions being steadily taken by the bifacial products. The rest vary quite a lot per month, with Longi’s products tending to hold the third and fourth positions, aside from an outlier month in August.
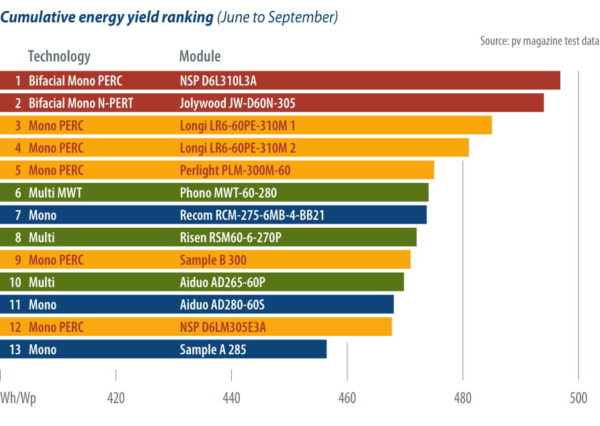
The graph above right at the top of p. 61 shows the ranking of all tested products according to their cumulative energy yield from June to September.
The table below left shows data for the bifacial output boost. The bifacial products remain in the lead overall, although there is a slight dip in performance in September. This is probably related to the very different climatic conditions prevailing in this month.
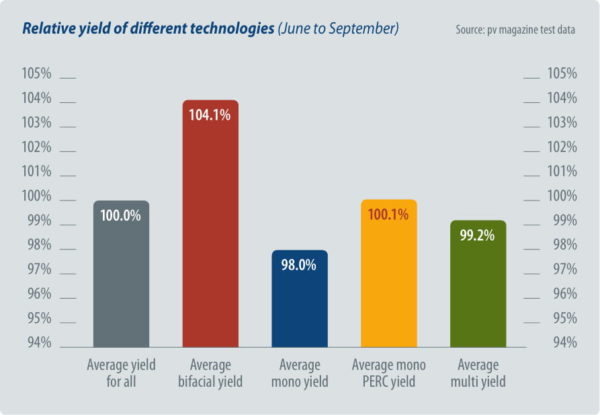
Among the monofacial technologies, passivated emitter rear contact (PERC) products remain the winner, as shown in the middle graph on p. 61 to the right, which depicts the different relative energy yields grouped by technology type.
|
Table 2 |
|||||
|
Total |
Total |
Total |
Total |
Cumulative Wh/Wp |
|
|
Average monthly yield |
115.0 |
116.6 |
144.6 |
99.6 |
475.8 |
|
Average monthly bifacial yield |
119.6 |
121.2 |
151.3 |
103.2 |
495.4 |
|
Average monthly monofacial yield |
114.2 |
115.8 |
143.4 |
98.9 |
472.3 |
|
Average bifacial boost |
4.8% |
4.7% |
5.5% |
4.3% |
4.9% |
|
Operation days |
27 |
27 |
31 |
30 |
115 |
|
Average daily yield |
4.26 |
4.32 |
4.67 |
3.32 |
|
|
Average daily bifacial yield |
4.43 |
4.49 |
4.88 |
3.44 |
|
|
Average daily monofacial yield |
4.23 |
4.29 |
4.63 |
3.30 |
|
|
Table 1 |
||||||||||||
|
Product # |
Product |
Type |
Total |
Total |
Total |
Total |
Grand |
June rank |
July rank |
August rank |
September rank |
Cumulative rank |
|
17 |
NSP D6L310L3A |
Bifacial mono PERC |
120.0 |
121.4 |
151.7 |
103.6 |
496.7 |
1 |
1 |
1 |
1 |
1 |
|
1 |
Jolywood JW-D60N-305 |
Bifacial n-PERT |
119.3 |
121.0 |
151.0 |
102.7 |
494.0 |
2 |
2 |
2 |
2 |
2 |
|
10 |
Recom RCM-275-6MB-4-BB21 |
Mono |
113.8 |
115.3 |
145.4 |
99.5 |
474.0 |
8 |
8 |
5 |
6 |
7 |
|
13 |
Sample A 285 |
Mono |
111.5 |
112.6 |
133.6 |
98.9 |
456.6 |
13 |
13 |
13 |
8 |
13 |
|
8 |
Aiduo AD280-60S |
Mono |
114.2 |
115.7 |
139.4 |
98.8 |
468.0 |
6 |
6 |
12 |
10 |
11 |
|
4 |
Perlight PLM-300M-60 |
Mono PERC |
115.2 |
116.1 |
145.2 |
98.8 |
475.2 |
5 |
5 |
6 |
9 |
5 |
|
7 |
Longi LR6-60PE-310M 1 |
Mono PERC |
116.9 |
119.0 |
148.7 |
100.6 |
485.1 |
4 |
4 |
3 |
4 |
3 |
|
12 |
NSP D6LM305E3A |
Mono PERC |
113.6 |
114.2 |
142.9 |
97.3 |
467.9 |
9 |
12 |
10 |
12 |
12 |
|
14 |
Sample B 300 |
Mono PERC |
114.1 |
115.2 |
144.8 |
96.8 |
471.0 |
7 |
9 |
8 |
13 |
9 |
|
16 |
Longi LR6-60PE-310M 2 |
Mono PERC |
117.9 |
119.2 |
142.6 |
101.4 |
481.2 |
3 |
3 |
11 |
3 |
4 |
|
3 |
Risen RSM60-6-270P |
Multi |
112.5 |
115.2 |
145.0 |
99.4 |
472.1 |
12 |
10 |
7 |
7 |
8 |
|
9 |
Aiduo AD265-60P |
Multi |
113.5 |
115.1 |
143.7 |
97.5 |
469.8 |
10 |
11 |
9 |
11 |
10 |
|
2 |
Phono MWT-60-280 |
Multi MWT |
112.9 |
115.6 |
146.1 |
99.5 |
474.2 |
11
|
7 |
4 |
5
|
6 |
This content is protected by copyright and may not be reused. If you want to cooperate with us and would like to reuse some of our content, please contact: editors@pv-magazine.com.