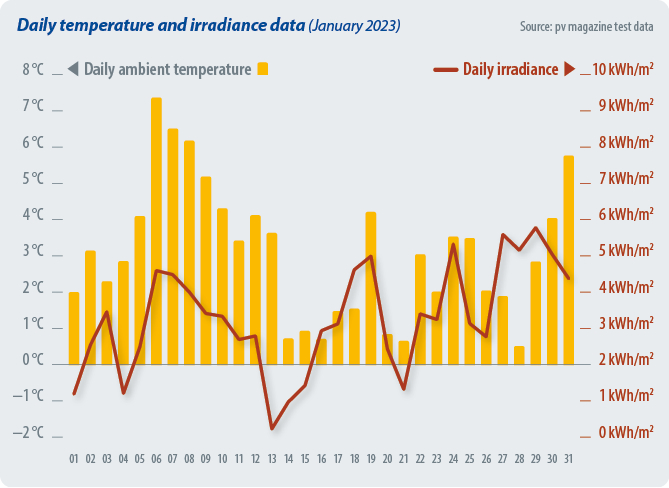
The chart above shows the meteo station data for January 2023. A new Tongwei bifacial PERC [passiavted emitter, rear contact] product has been installed. The average bifacial boost – the relative advantage of the average specific energy yield for all bifacial products, compared to all monofacial mono PERC products – is 6.73%.
The following chart shows the relative specific energy yield comparison between module technologies. While the top performer is Longi’s bifacial PERC module, the average specific energy yield of the bifacial TOPCon [tunnel-oxide passiavted contact] category leads overall, compared to the bifacial PERC solar modules.
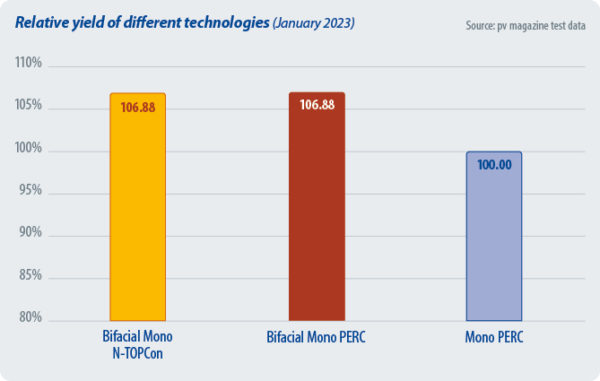
Our test field currently has just one sample from Jolywood in the n-TOPCon [negatively-doped TOPCon] bifacial category. As TOPCon becomes more prominent, we look forward to installing more samples of this type for a more representative yield comparison.
Energy yield measurements
The energy yield comparison among various technologies, including bifacial boost, will be analyzed using products installed after the beginning of 2019.
Energy yield is given in Wh/Wp and calculated by dividing the energy produced by the module by the Pmax at STC [standard testing conditions] of the module. This Pmax is the maximum STC power after stabilization.
Results are grouped in categories, per module type.
Bifacial boost depends on many parameters: the bifaciality factor, the installation geometry, the albedo of the ground, the sun angle, and diffuse irradiance. The ground in this case is gray gravel.
Bifacial boost
| All in Wh/Wp | Total Oct. 2022 | Total Nov. 2022 | Total Dec. 2022 | Total Jan. 2023 |
|---|---|---|---|---|
| Average monthly yield | 76.66 | 59.40 | 88.73 | 92.10 |
| Average monthly bifacial yield | 80.12 | 61.46 | 91.39 | 95.57 |
| Average monthly monofacial Mono PERC yield | 75.25 | 58.30 | 86.71 | 89.55 |
| Operation days | 31 | 30 | 31 | 31 |
| Average daily yield | 2.47 | 1.98 | 2.86 | 2.97 |
| Average daily bifacial yield | 2.58 | 2.05 | 2.95 | 3.08 |
| Average daily monofacial yield | 2.43 | 1.94 | 2.80 | 2.89 |
| Bifacial boost | 6.48% | 5.42% | 5.40% | 6.73% |
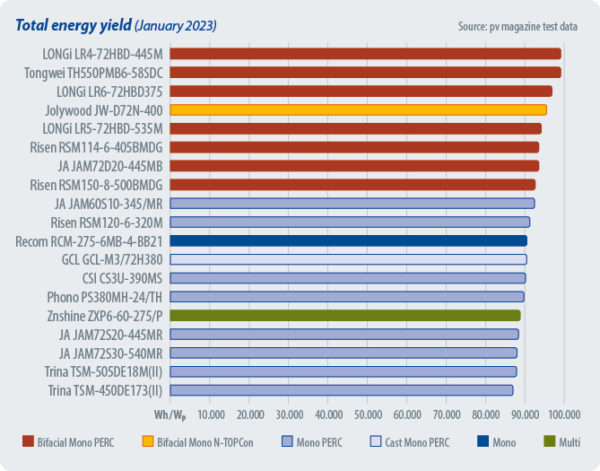
Specific energy yield ranking – historical
| # | Installation month | Product | Type | Total Dec. 2022 Wh/Wp | Total Jan. 2023 Wh/Wp | Total Feb. 2023 Wh/Wp | Total March 2023 Wh/Wp | Dec. 2022 Rank | Jan. 2023 Rank | Feb. 2023 Rank | March 2023 Rank |
|---|---|---|---|---|---|---|---|---|---|---|---|
| 37 | 01/05/2021 | LONGi LR4-72HBD-445M | Bifacial Mono PERC | 96.388 | 99.130 | 76.041 | 147.811 | 1 | 1 | 1 | 1 |
| 27 | 31/12/2019 | Jolywood JW-D72N-400 | Bifacial Mono N-TOPCon | 91.938 | 95.573 | 74.278 | 145.337 | 3 | 4 | 4 | 2 |
| 26 | 28/08/2019 | LONGi LR6-72HBD375 | Bifacial Mono PERC | 93.093 | 96.879 | 74.452 | 145.191 | 2 | 3 | 3 | 3 |
| 41 | 18/12/22 | Tongwei TH550PMB6-58SDC | Bifacial Mono PERC | / | 99.117 | 75.466 | 143.870 | / | 2 | 2 | 4 |
| 28 | 15/04/2020 | Risen RSM114-6-405BMDG | Bifacial Mono PERC | 90.466 | 93.545 | 72.269 | 140.782 | 6 | 6 | 5 | 5 |
| 38 | 20/11/2021 | LONGi LR5-72HBD-535M | Bifacial Mono PERC | 89.960 | 94.186 | 71.262 | 140.464 | 5 | 5 | 6 | 6 |
| 34* | 01/07/2021 | JA JAM72D20-445MB | Bifacial Mono PERC | 89.806 | 93.545 | 70.777 | 138.905 | 7 | 7 | 7 | 7 |
| 32 | 01/07/2021 | Risen RSM150-8-500BMDG | Bifacial Mono PERC | 88.083 | 92.619 | 70.239 | 138.846 | 12 | 8 | 8 | 8 |
| 31* | 01/10/2020 | JA JAM60S10-345/MR | Mono PERC | 90.535 | 92.506 | 70.121 | 136.008 | 4 | 9 | 9 | 9 |
| 30 | 07/07/2020 | GCL GCL-M3/72H380 | Cast Mono PERC | 88.623 | 90.520 | 69.185 | 135.559 | 10 | 12 | 10 | 10 |
| 29* | 07/07/2020 | CSI CS3U-390MS | Mono PERC | 88.700 | 90.234 | 69.027 | 134.979 | 9 | 13 | 12 | 11 |
| 35* | 01/07/2021 | JA JAM72S20-445MR | Mono PERC | 85.476 | 88.464 | 67.197 | 134.127 | 15 | 16 | 15 | 12 |
| 20 | 21/11/2018 | Phono PS380MH-24/TH | Mono PERC | 87.612 | 89.830 | 68.480 | 133.433 | 13 | 14 | 14 | 13 |
| 21 | 01/03/2019 | Risen RSM120-6-320M | Mono PERC | 89.239 | 91.322 | 69.046 | 130.769 | 8 | 10 | 11 | 14 |
| 36* | 20/11/2021 | JA JAM72S30-540MR | Mono PERC | 84.495 | 88.043 | 66.220 | 130.468 | 17 | 17 | 18 | 15 |
| 10 | 24/05/2018 | Recom RCM-275-6MB-4-BB21 | Mono | 88.285 | 90.559 | 68.753 | 121.951 | 11 | 11 | 13 | 16 |
| 23 | 04/05/2019 | Znshine ZXP6-60-275/P | Multi | 87.179 | 88.829 | 66.937 | 119.592 | 14 | 15 | 16 | 17 |
This content is protected by copyright and may not be reused. If you want to cooperate with us and would like to reuse some of our content, please contact: editors@pv-magazine.com.