After one month down for upgrades, the new array was brought online in mid-January, after which, 15 days of data were collected. Results from the first bifacial heterojunction (HJT) module in the test program are included. A new bifacial tunnel oxide passivated contact (TOPCon) module, from SEG Solar, was also added to the array.
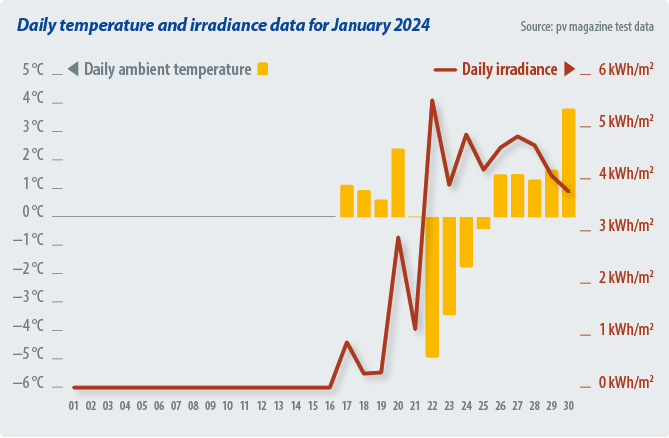
A total of five products had to be removed from this month’s results, as two presented irregular performance, requiring investigation, and three temporarily lost connection with the data collection system. The main chart, above, shows the meteo station data (irradiance and ambient temperature) for the second half of January 2024. The average bifacial boost was 4.17% for January 2024. Bifacial boost is defined as the relative advantage of the average specific energy yield of all bifacial products compared to the average specific energy yield of all monofacial passivated emitter rear contact (PERC) products.
Monthly highlight
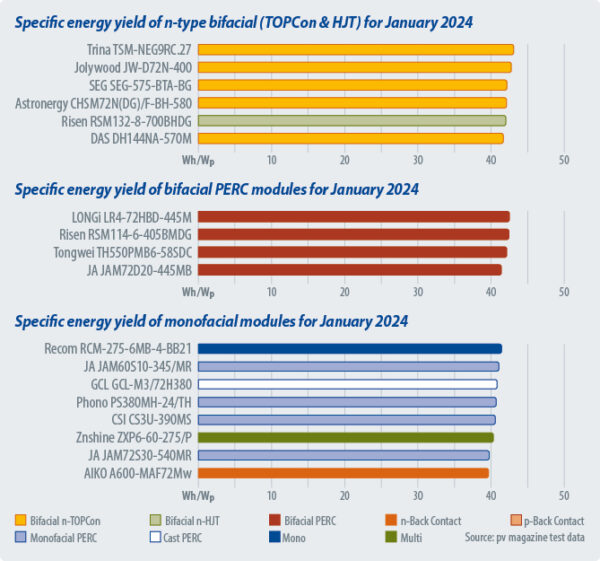
In the monofacial product ranking for January, Recom’s older technology, mono back-surface-field product got top rank while Aiko’s TOPCon back-contact (BC) panel product ranked last. This may seem counterintuitive but a look at the climatic conditions explains everything. For most of the days that data was collected the temperature was just above, or even below 0 C. Older-technology products have maximum power point (Pmax) temperature coefficients close to -0.45% per degree Celsius, as opposed to -0.35 % per degree Celsius for PERC, -0.29 % per degree Celsius for TOPCon, and -0.26 % per degree Celsius for Aiko’s BC. For older panels, operation in a cold environment increases the power faster than modules with “better” coefficients, and this explains the observed results for January.
Bifacial boost
| All in Wh/Wp | Total Sep. 2023 | Total Oct. 2023 | Total Nov. 2023 | Total Jan. 2024 |
|---|---|---|---|---|
| Average monthly yield | 103.62 | 102.68 | 40.36 | 41.62 |
| Average monthly bifacial yield | 108.65 | 105.91 | 42.08 | 42.37 |
| Average monthly monofacial PERC yield | 99.28 | 100.37 | 40.20 | 40.67 |
| Operation days | 29 | 28 | 14 | 15 |
| Average daily yield | 3.57 | 3.67 | 2.88 | 2.77 |
| Average daily bifacial yield | 3.75 | 3.78 | 3.01 | 2.82 |
| Average daily monofacial PERC yield | 3.42 | 3.58 | 2.87 | 2.71 |
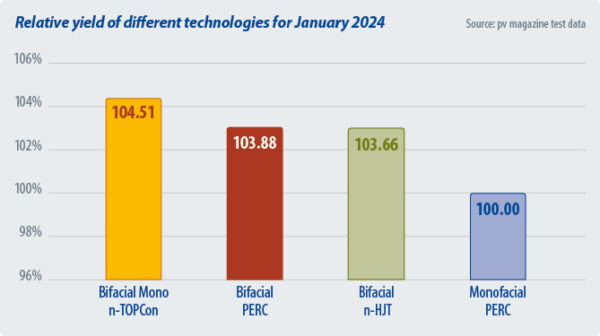
| Bifacial TOPCon boost | 10.88% | 5.74% | 5.22% | 4.51% |
| Bifacial HJT boost | N/A | N/A | N/A | 3.66% |
| Bifacial PERC boost | 8.21% | 5.32% | 4.23%% | 3.88% |
| All technologies bifacial boost | 9.16% | 5.52% | 4.69% | 4.17% |
Specific energy yield ranking of n-type bifacial TOPCon and HJT modules
| # | Installation month | Product | Type | Sample selection method | Total Jan. 2024 Wh/Wp | Jan. 2024 Rank |
|---|---|---|---|---|---|---|
| 45 | 2023/8/15 | Trina TSM-NEG9RC.27 | n-TOPCon | 3 | 41.81 | 1 |
| 27 | 2023/6/5 | Jolywood JW-D72N-400 | n-TOPCon | 3 | 42.12 | 2 |
| 53 | 2023/11/15 | SEG SEG-575-BTA-BG | n-TOPCon | 3 | 42.31 | 3 |
| 50 | 2023/9/1 | Astronergy CHSM72N(DG)/F-BH-580 | n-TOPCon | 3 | 42.09 | 4 |
| 51 | 2023/10/31 | Risen RSM132-8-700BHDG | n-HJT | 3 | 42.16 | 5 |
| 42 | 2023/6/5 | DAS DH144NA | n-TOPCon | 3 | 44.13 | 6 |
Specific energy yield ranking of bifacial PERC modules
| # | Installation month | Product | Type | Sample selection method | Total Jan. 2024 Wh/Wp | Jan. 2024 Rank |
|---|---|---|---|---|---|---|
| 37 | 2021/5/1 | LONGi LR4-72HBD-445M | Bifacial PERC | 3 | 42.63 | 1 |
| 28 | 2020/4/15 | Risen RSM114-6-405BMDG | Bifacial PERC | 3 | 42.57 | 2 |
| 41 | 2022/12/18 | Tongwei TH550PMB6-58SDC | Bifacial PERC | 1 | 42.28 | 3 |
| 34 | 2021/7/1 | JA JAM72D20-445MB | Bifacial PERC | 2 | 41.53 | 4 |
Specific energy yield ranking of monofacial modules
| # | Installation month | Product | Type | Sample selection method | Total Jan. 2024 Wh/Wp | Pmax temp. coeff. (%/degree C) | Jan 2024. Rank |
|---|---|---|---|---|---|---|---|
| 10 | 2018/5/24 | Recom RCM-275-6MB-4-BB21 | Mono | 1 | 41.58 | -0.45 | 1 |
| 31 | 2020/10/1 | JA JAM60S10-345/MR | PERC | 2 | 41.21 | -0.41 | 2 |
| 30 | 2020/7/7 | GCL GCL-M3/72H380 | Cast PERC | 1 | 40.98 | -0.38 | 3 |
| 20 | 2018/11/21 | Phono PS380MH-24/TH | PERC | 1 | 40.85 | -0.39 | 4 |
| 29 | 2020/7/7 | CSI CS3U-390MS | PERC | 2 | 40.73 | -0.38 | 5 |
| 22 | 2019/5/4 | Znshine ZXP6-60-275/P | Multi | 1 | 40.46 | -0.47 | 6 |
| 36 | 2021/11/20 | JA JAM72S30-540MR | PERC | 2 | 39.89 | -0.35 | 7 |
| 44 | 2023/9/1 | AIKO A600-MAF72Mw | N-back contact | 3 | 39.80 | -0.26 | 8 |
Energy yield measurements
- The energy yield comparison among various technologies, including bifacial boost, has been analyzed using products installed after the beginning of 2019.
- The energy yield was given in Wh produced per Wp of module generation capacity and calculated by dividing the energy produced by the module by its Pmax at standard test conditions (STC) for the module. This Pmax was the maximum STC power after a process of stabilization.
- The results have been grouped into categories, per module type.
- The bifacial boost depends on many parameters: bifaciality factor, installation geometry, albedo of the ground, the sun angle, and diffuse irradiance. The ground, in this case, is gray gravel.
Test cooperation
This content is protected by copyright and may not be reused. If you want to cooperate with us and would like to reuse some of our content, please contact: editors@pv-magazine.com.