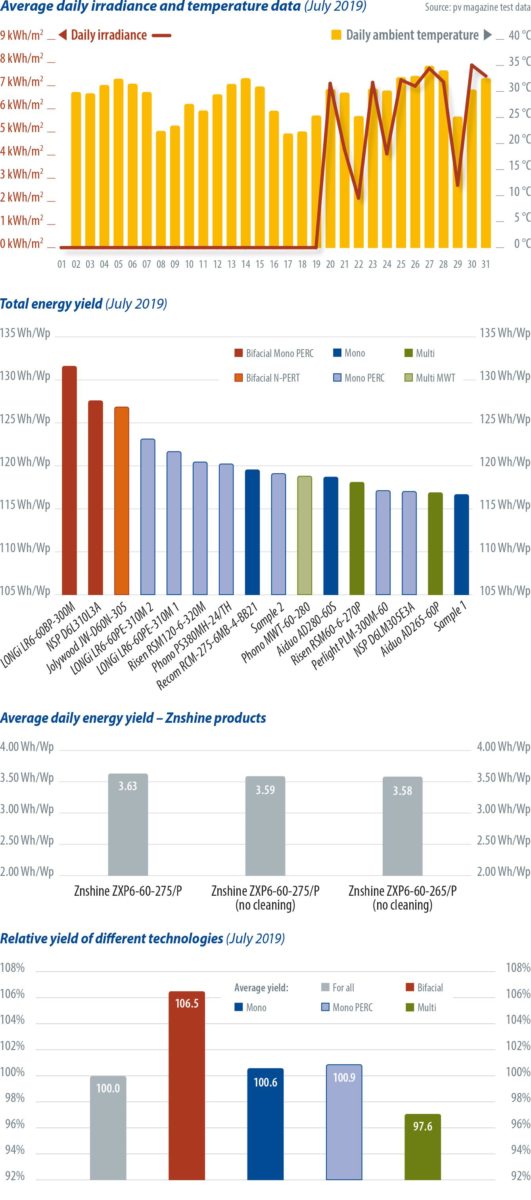
The first graph to the right charts the meteo station data for July 2019. The system was offline due to a power cut on July 1. The irradiance meters were uninstalled for calibration from July 1 to 19. Energy yield data were collected for 30 days from July 2 to July 30. Meteo data were collected for 12 days from July 20 to July 31.
Monthly energy yield data from February to July 2019 are given in the table below. The second graph to the right shows the total energy yield of all products for July 2019.
Three Znshine products, two with graphene coated glass (ZXP6-60-275/P) and one with regular glass (ZXP6-60-265/P), were added to the test from the beginning of the month. The graphene coating claims to increase the transmission properties of the glass, and also to have a self-cleaning effect, reducing O&M costs for commercial and utility-scale PV power plants.
A control test was set up for the two modules with graphene coated glass: one is cleaned weekly while the other is not cleaned at all. The module with regular glass, which is not cleaned, was installed as a reference to provide a baseline to observe the level of dust accumulation. The average energy yield of the three products is charted in the third graph to the right. The yield data of the “not cleaned” graphene coated module and the “not cleaned” regular module do not exhibit a significant difference. Thus, the self-cleaning effect of the graphene coated glass is not evident yet and needs to be further investigated as more data points are collected.
The overall bifacial boost for July 2019 averages 8.1%. Bifacial boost is defined as the extra energy yield of the bifacial products compared to the average energy yield of all mono-facial products.
The graph to the bottom right shows the comparison between different module technologies for July 2019. Bifacial modules are performing above the average energy yield level, with multi-crystalline silicon PV performing below the average energy yield level.
George Touloupas
Test cooperation
Average daily and monthly yields | ||||||
all in Wh/Wp | Feb 2019 | Mar 2019 | Apr 2019 | May 2019 | Jun 2019 | Jul 2019 |
Average monthly yield | 75.31 | 133.23 | 83.11 | 96.00 | 83.83 | 120.88 |
Average monthly bifacial yield | 79.46 | 139.23 | 87.64 | 101.91 | 89.64 | 128.70 |
Average monthly monofacial yield | 74.28 | 131.85 | 82.06 | 94.64 | 82.49 | 119.07 |
Operation days | 28 | 31 | 21 | 25 | 26 | 30 |
Average daily yield | 2.69 | 4.30 | 3.96 | 3.84 | 3.22 | 4.03 |
Average daily bifacial yield | 2.84 | 4.49 | 4.17 | 4.08 | 3.45 | 4.29 |
Average daily monofacial yield | 2.65 | 4.25 | 3.91 | 3.79 | 3.17 | 3.97 |
Bifacial boost | 7.0% | 5.6% | 6.8% | 7.7% | 8.7% | 8.1% |
Energy yield ranking | ||||||||||||||
# | Product | Type | Total Feb 2019 | Total Mar 2019 | Total Apr 2019 | Total May 2019 | Total June 2019 | Total July 2019 | Feb 2019 rank | Mar 2019 rank | Apr 2019 rank | May 2019 rank | Jun 2019 rank | July 2019 rank |
18 | LONGi LR6-60BP-300M | Bifacial Mono PERC | 81.23 | 142.28 | 89.60 | 103.89 | 91.53 | 131.61 | 1 | 1 | 1 | 1 | 1 | 1 |
17 | NSP D6L310L3A | Bifacial Mono PERC | 78.91 | 138.37 | 86.84 | 101.05 | 89.09 | 127.61 | 2 | 2 | 2 | 2 | 2 | 2 |
1 | Jolywood JW-D60N-305 | Bifacial N-PERT | 78.22 | 137.05 | 86.47 | 100.80 | 88.31 | 126.88 | 3 | 3 | 3 | 3 | 3 | 3 |
16 | LONGi LR6-60PE-310M 2 | Mono PERC | 76.43 | 135.64 | 84.47 | 97.70 | 85.24 | 123.17 | 4 | 4 | 4 | 4 | 4 | 4 |
7 | LONGi LR6-60PE-310M 1 | Mono PERC | 75.79 | 134.69 | 83.86 | 97.12 | 84.16 | 121.70 | 5 | 5 | 5 | 5 | 5 | 5 |
21 | Risen RSM120-6-320M | Mono PERC | – | 131.52 | 82.20 | 95.35 | 83.67 | 120.49 | – | 12 | 8 | 6 | 6 | 6 |
20 | Phono PS380MH-24/TH | Mono PERC | 74.38 | 132.18 | 82.29 | 94.39 | 83.26 | 120.27 | 10 | 6 | 6 | 10 | 7 | 7 |
10 | Recom RCM-275-6MB-4-BB21 | Mono | 74.62 | 131.72 | 81.94 | 94.90 | 82.75 | 119.59 | 6 | 9 | 10 | 8 | 9 | 8 |
14 | Sample 2 | Mono PERC | 74.50 | 132.00 | 82.22 | 95.23 | 82.87 | 119.14 | 8 | 7 | 7 | 7 | 8 | 9 |
2 | Phono MWT-60-280 | Multi MWT | 72.64 | 131.19 | 81.64 | 94.42 | 81.90 | 118.85 | 14 | 13 | 13 | 9 | 11 | 10 |
8 | Aiduo AD280-60S | Mono | 74.18 | 131.71 | 81.93 | 93.90 | 82.17 | 118.75 | 11 | 10 | 11 | 14 | 10 | 11 |
3 | Risen RSM60-6-270P | Multi | 72.61 | 131.11 | 81.46 | 94.12 | 81.62 | 118.13 | 15 | 14 | 14 | 11 | 13 | 12 |
4 | Perlight PLM-300M-60 | Mono PERC | 74.48 | 131.60 | 81.95 | 93.92 | 81.66 | 117.17 | 9 | 11 | 9 | 13 | 12 | 13 |
12 | NSP D6LM305E3A | Mono PERC | 74.54 | 131.73 | 81.84 | 94.04 | 81.46 | 117.07 | 7 | 8 | 12 | 12 | 14 | 14 |
9 | Aiduo AD265-60P | Multi | 73.55 | 130.36 | 81.19 | 92.88 | 80.61 | 116.92 | 13 | 15 | 15 | 15 | 16 | 15 |
13 | Sample 1 | Mono | 73.62 | 128.56 | 79.79 | 92.30 | 80.99 | 116.72 | 12 | 16 | 16 | 16 | 15 | 16 |

This content is protected by copyright and may not be reused. If you want to cooperate with us and would like to reuse some of our content, please contact: editors@pv-magazine.com.
