Figure 1 (below) charts the meteo station data (irradiance and ambient temperature) for July 2022. The testing facility experienced a power cut from July 15-19. The average bifacial boost is 10.53%. Bifacial boost is defined as the relative advantage of the average specific energy yield of all bifacial products compared to the average specific energy yield of all mono-facial PERC products.
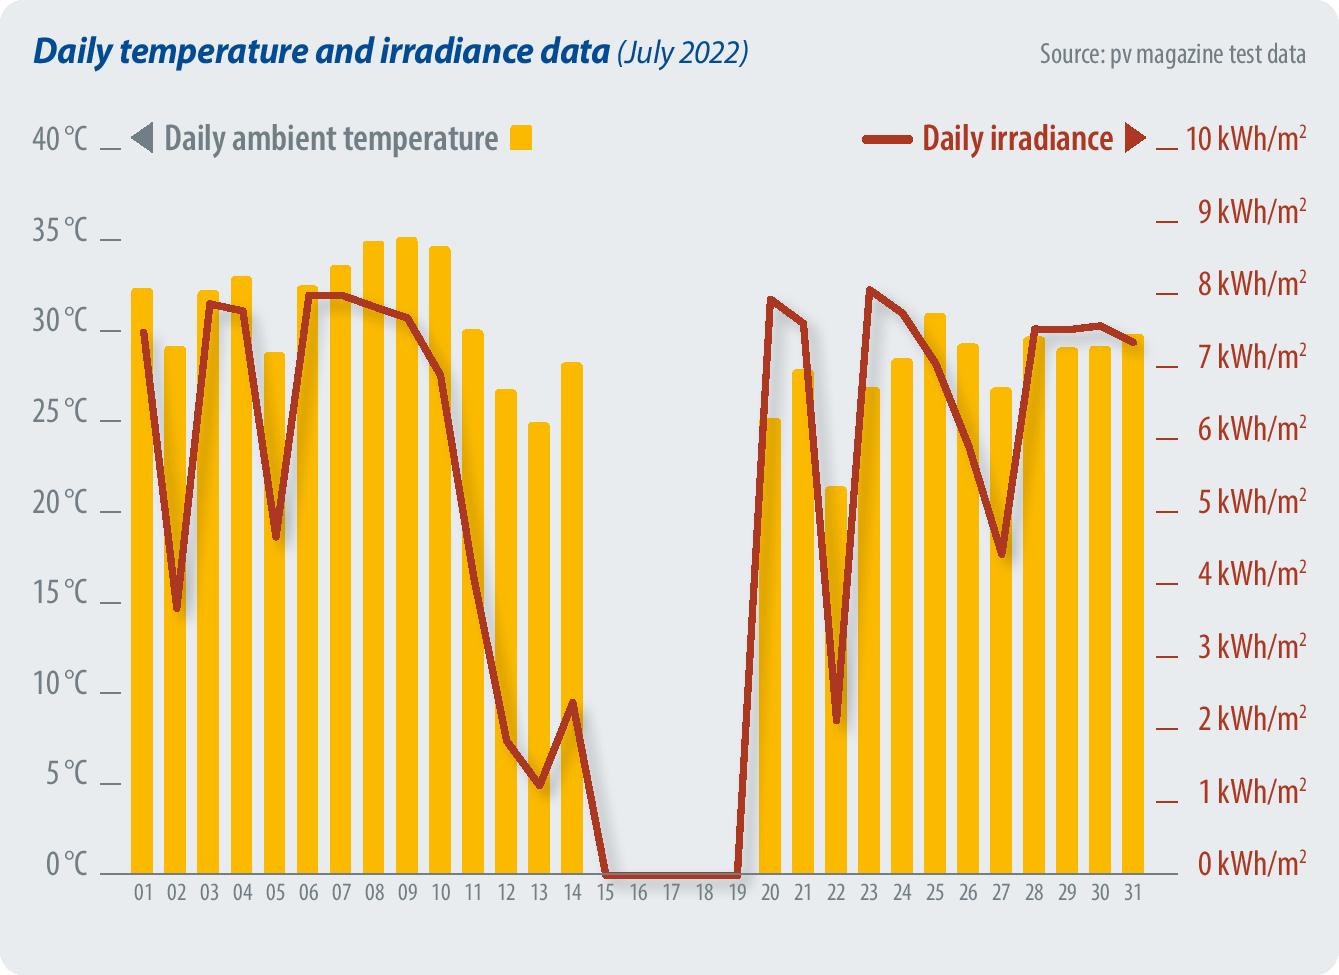
Figure 3 (below) shows the relative specific energy yield comparison between different solar module technologies.
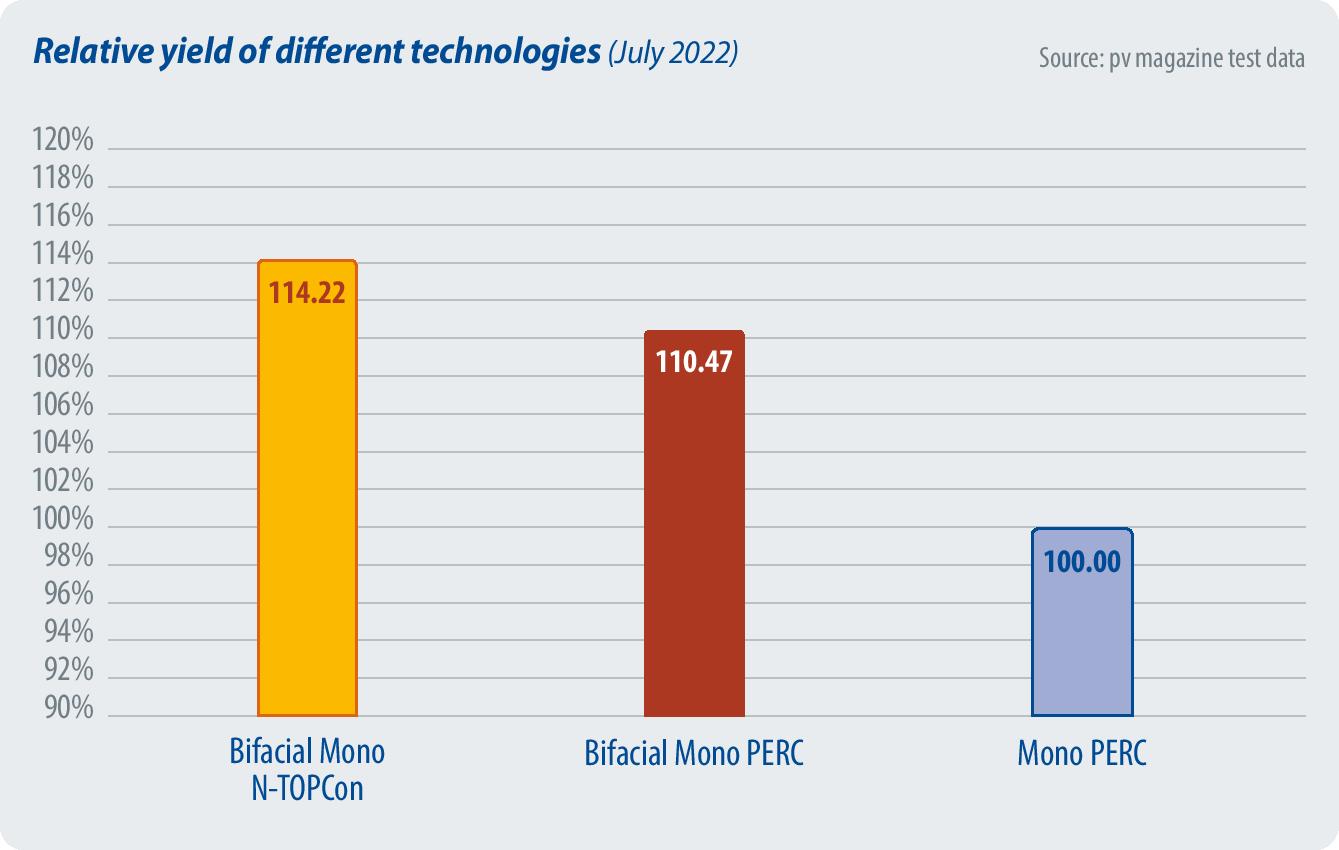
Although the top performer is Longi’s bifacial PERC module, the average specific energy yield of the bifacial TOPCon category leads over the average specific energy yield of modules in the bifacial PERC category.
Our test field only has one sample from Jolywood in the n-TOPCon bifacial category. As TOPCon modules become more prominent, we look forward to installing more samples for a more representative yield comparison.
Energy yield measurements
- The energy yield comparison among various technologies, including bifacial boost, will be analyzed using products installed after the beginning of 2019.
- The energy yield is given in Wh/Wp and calculated by dividing the energy produced by the Pmax at STC of the module. This Pmax is the maximum STC power after a process of stabilization.
- The results are grouped in categories, per module type.
- The bifacial boost depends on many parameters: the bifaciality factor, the installation geometry, the albedo of the ground, and the sun angle and diffuse irradiance. The ground in this case is gray gravel.

| Bifacial boost | ||||
| all in Wh/Wp | Total Apr 2022 | Total May 2022 | Total June 2022 | Total July 2022 |
| Average monthly yield | 135.23 | 155.23 | 154.20 | 137.548 |
| Average monthly bifacial yield | 145.65 | 166.49 | 168.17 | 149.248 |
| Average monthly monofacial Mono PERC yield | 131.29 | 152.59 | 151.37 | 135.031 |
| Operation days | 30 | 31 | 28 | 26 |
| Average daily yield | 4.51 | 5.01 | 5.51 | 5.290 |
| Average daily bifacial yield | 4.86 | 5.37 | 6.01 | 5.740 |
| Average daily monofacial yield | 4.38 | 4.92 | 5.41 | 5.193 |
| Bifacial boost | 10.9% | 9.11% | 11.10% | 10.53% |
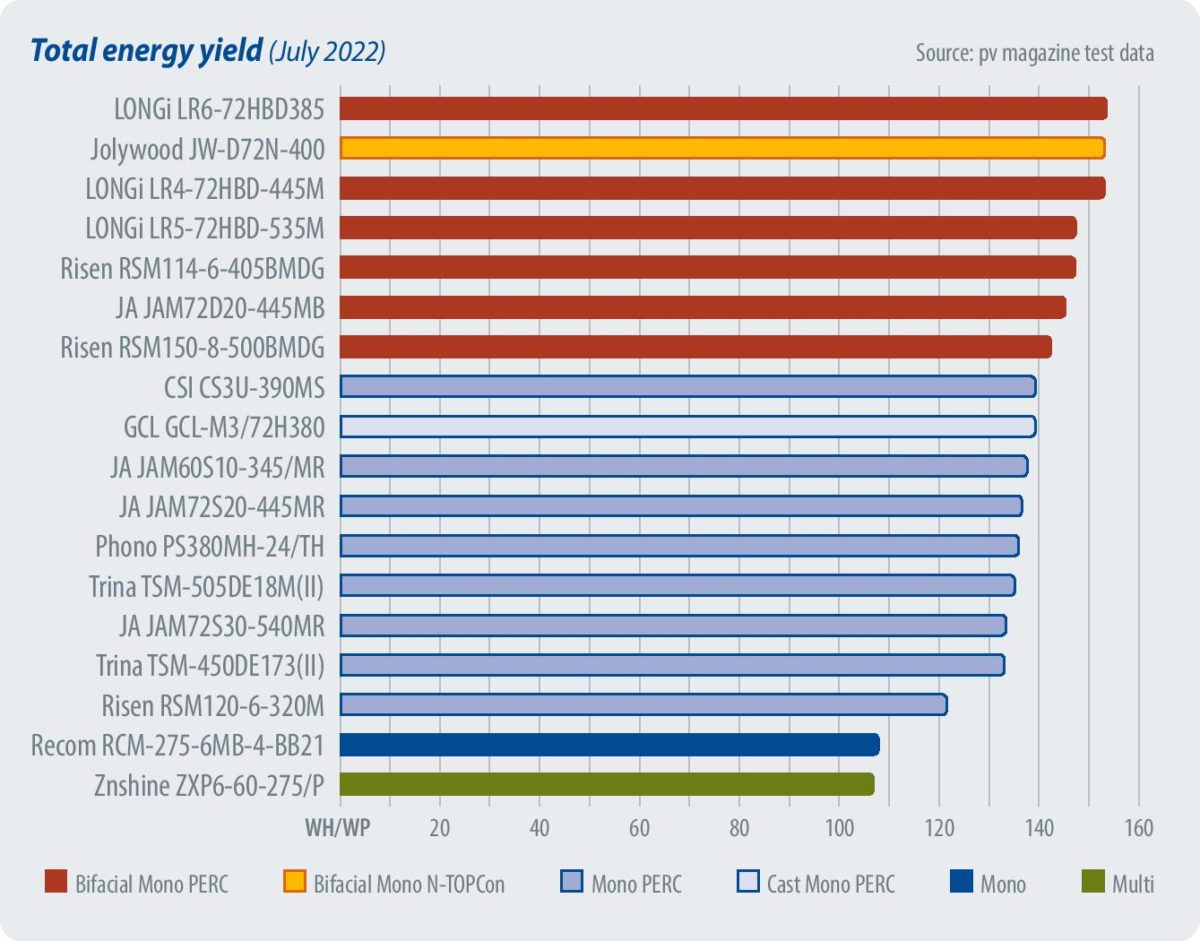
| Specific energy yield ranking – historical | |||||||||||
| # | Installation Month | Product | Type | TotalApr2022 Wh/Wp | Total May2022 Wh/Wp | Total June2022 Wh/Wp | Total July2022 Wh/Wp | Apr 2022 Rank | May 2022 Rank | June 2022 Rank | July 2022 Rank |
| 26 | 8/28/2019 | LONGi LR6-72HBD385 | Bifacial Mono PERC | 150.162 | 171.16684 | 172.43214 | 153.92855 | 1 | 1 | 3 | 1 |
| 27 | 12/31/2019 | Jolywood JW-D72N-400 | Bifacial Mono N-TOPCon | 148.735 | 170.92764 | 173.22038 | 153.57374 | 3 | 2 | 2 | 2 |
| 37 | 5/1/2021 | LONGi LR4-72HBD-445M | Bifacial Mono PERC | 149.532 | 170.71304 | 173.31933 | 153.48704 | 2 | 3 | 1 | 3 |
| 38 | 11/20/2021 | LONGi LR5-72HBD-535M | Bifacial Mono PERC | 143.655 | 164.3878 | 166.20594 | 147.72068 | 5 | 5 | 4 | 4 |
| 28 | 4/15/2020 | Risen RSM114-6-405BMDG | Bifacial Mono PERC | 143.790 | 164.6408 | 165.75472 | 147.62384 | 4 | 4 | 5 | 5 |
| 34* | 7/1/2021 | JA JAM72D20-445MB | Bifacial Mono PERC | 142.766 | 162.82478 | 163.81629 | 145.65588 | 6 | 6 | 6 | 6 |
| 32 | 7/1/2021 | Risen RSM150-8-500BMDG | Bifacial Mono PERC | 140.941 | 160.7569 | 162.45779 | 142.74729 | 7 | 7 | 7 | 7 |
| 29* | 7/7/2020 | CSI CS3U-390MS | Mono PERC | 136.226 | 155.48622 | 156.05588 | 139.66349 | 12 | 8 | 8 | 8 |
| 30 | 7/7/2020 | GCL GCL-M3/72H380 | Cast Mono PERC | 136.622 | 155.45889 | 155.92979 | 139.63098 | 9 | 9 | 9 | 9 |
| 31* | 10/1/2020 | JA JAM60S10-345/MR | Mono PERC | 136.539 | 155.18962 | 153.82776 | 138.02714 | 10 | 11 | 11 | 10 |
| 35* | 7/1/2021 | JA JAM72S20-445MR | Mono PERC | 136.389 | 155.35231 | 155.60442 | 136.9333 | 11 | 10 | 10 | 11 |
| 20 | 11/21/2018 | Phono PS380MH-24/TH | Mono PERC | 139.528 | 154.79687 | 152.0009 | 136.34529 | 8 | 12 | 13 | 12 |
| 40* | 11/20/2021 | Trina TSM-505DE18M(II) | Mono PERC | 133.449 | 151.85355 | 152.29831 | 135.52044 | 14 | 14 | 12 | 13 |
| 36* | 11/20/2021 | JA JAM72S30-540MR | Mono PERC | 134.024 | 152.02315 | 151.41149 | 133.77991 | 13 | 13 | 14 | 14 |
| 33* | 7/1/2021 | Trina TSM-450DE173(II) | Mono PERC | 132.261 | 150.62826 | 150.58226 | 133.45881 | 15 | 15 | 15 | 15 |
| 21 | 3/1/2019 | Risen RSM120-6-320M | Mono PERC | 127.453 | 142.5313 | 134.6321 | 121.91622 | 16 | 16 | 16 | 16 |
| 10 | 5/24/2018 | Recom RCM-275-6MB-4-BB21 | Mono | 117.631 | 128.12397 | 118.99804 | 108.22075 | 17 | 17 | 17 | 17 |
| 23 | 5/4/2019 | Znshine ZXP6-60-275/P (no cleaning) | Multi | 115.167 | 126.77549 | 116.64069 | 107.23225 | 18 | 18 | 18 | 18 |
| *Purchased products from the market, which bypassed the random sampling process. All other products were provided by the suppliers. | |||||||||||
Test cooperation
pv magazine test is a cooperative effort involving pv magazine, APsystems, CEA and Gsolar. All testing procedures are carried out at Gsolar’s test laboratory in Xi’an, China. CEA supervises these tests and designed both the indoor and outdoor testing procedures.
By George Touloupas
This content is protected by copyright and may not be reused. If you want to cooperate with us and would like to reuse some of our content, please contact: editors@pv-magazine.com.