
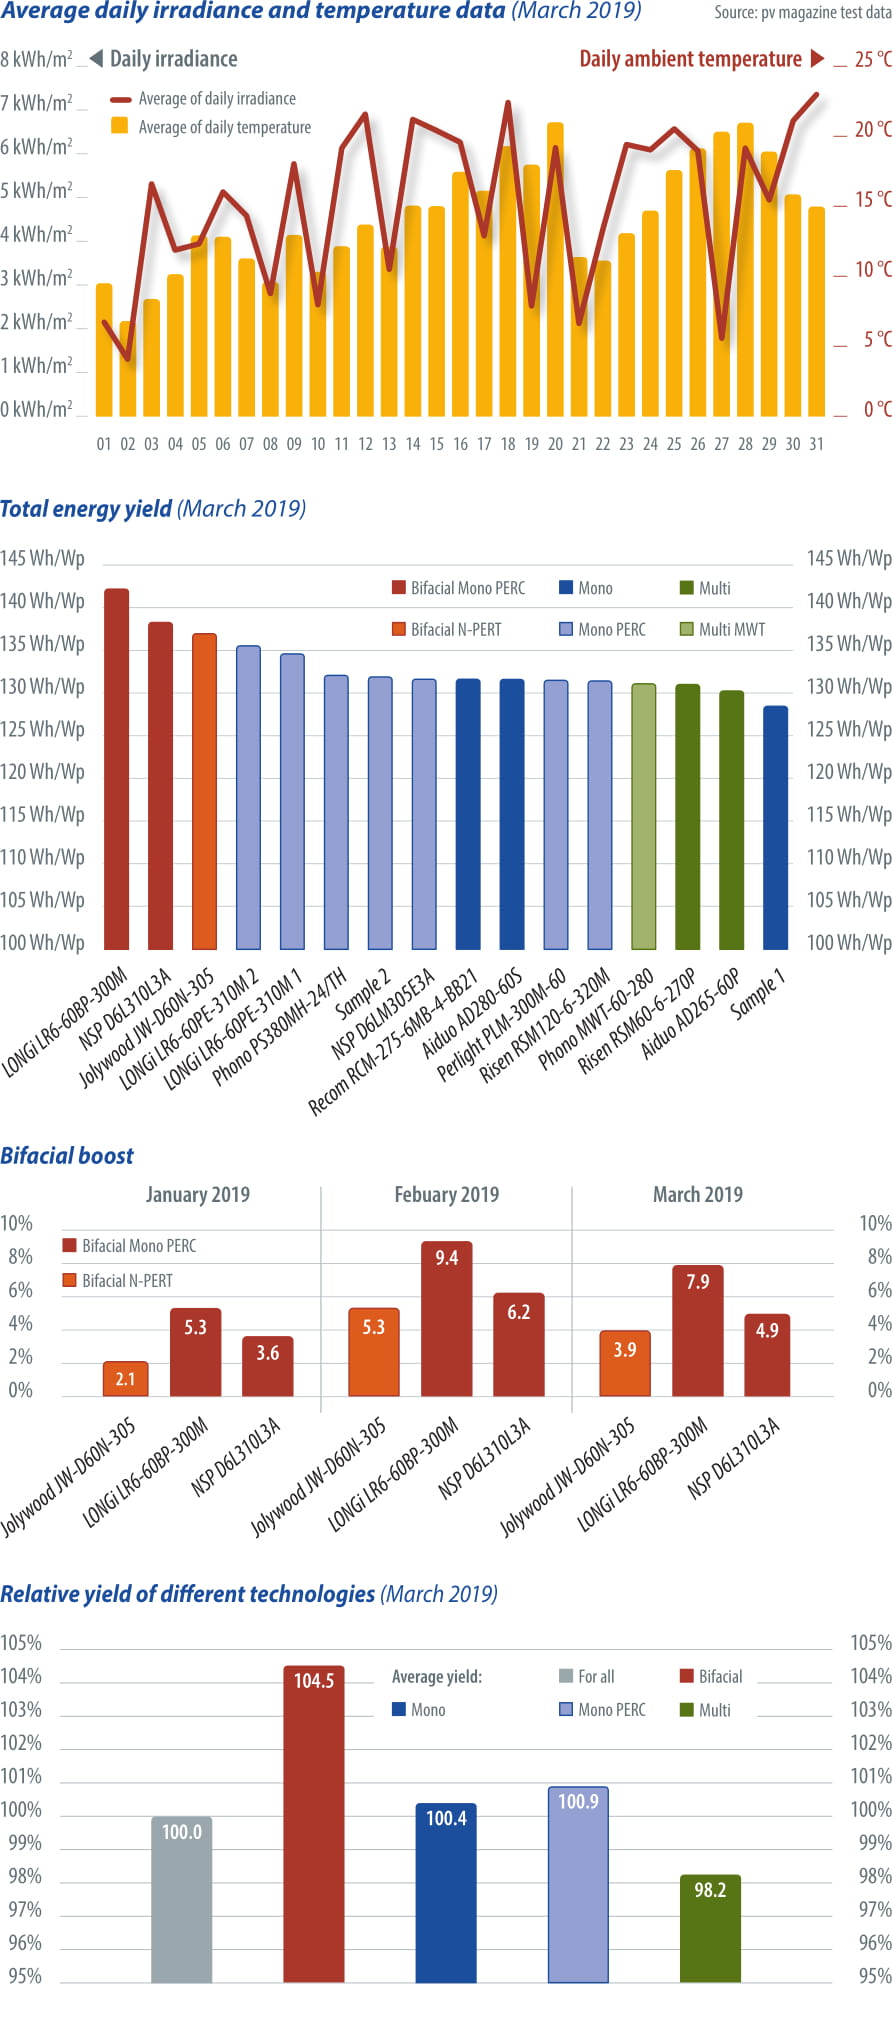
Yield data from October 2018 to March 2019 are in the table below. The second graph to the right shows the total energy yield for March. A new half-cut mono PERC module from Risen (RSM120-6-320M) was installed on March 1.
The bifacial boost for March 2019 was 5.6%. Since we have now had three bifacial products installed for several months, we decided to take a deeper look at the bifacial boost data for the past three months, that is, the extra energy yield of the bifacial products compared with the average of all monofacial products. The third chart to the right shows the boost from two mono PERC products and one n-PERT product. February saw an abnormally high bifacial boost due to snow coverage.
Characterizing performance
The three bifacial products have very different performance, with Longi leading the pack, NSP in the middle, and Jolywood trailing. Obviously, not all bifacial products have the same performance in the field. The test’s definition of bifacial boost is not the one normally used, where a bifacial product is compared with a monofacial product utilizing the same cell technology and under the same conditions. In our case, the boost is relative to the average of all monofacial products, and includes any front side advantages.
Comparing the NSP product with the one from Longi, we observe its lower bifaciality ratio, better low irradiance behavior, and worse temperature coefficient. Assuming the bifaciality ratio has higher impact on performance and that the other factors cancel out, the boost difference might be explained. Regarding the Jolywood product, though it has the highest bifaciality ratio of all, and very good low light and temperature coefficient characteristics, it also has the lowest boost. We need to analyze more data and conduct further investigation to assess the root causes of the differences in bifacial boost among these products.
The graph to the bottom right shows the comparison between different technologies. Bifacial modules are steadily performing above the average yield level, with multi c-Si PV performing below the average. George Touloupas
# | Product | Type | Total Oct 2018 Wh/Wp | Total Nov 2018 Wh/Wp | Total Dec 2018 Wh/Wp | Total Jan 2019 Wh/Wp | Total Feb 2019 Wh/Wp | Total Mar 2019 Wh/Wp | Oct 2018 rank | Nov 2018 rank | Dec 2018 rank | Jan 2019 rank | Feb 2019 rank | Mar 2019 rank |
18 | LONGi LR6-60BP-300M | Bifacial Mono PERC | – | 78.74 | 68.82 | 68.07 | 81.23 | 142.28 | – | 1 | 1 | 1 | 1 | 1 |
17 | NSP D6L310L3A | Bifacial Mono PERC | 128.10 | 76.51 | 67.05 | 66.96 | 78.91 | 138.37 | 1 | 3 | 2 | 2 | 2 | 2 |
1 | Jolywood JW-D60N-305 | Bifacial N-PERT | 127.00 | 75.44 | 66.68 | 65.98 | 78.22 | 137.05 | 2 | 5 | 4 | 4 | 3 | 3 |
16 | LONGi LR6-60PE-310M 2 | Mono PERC | 125.30 | 76.57 | 67.05 | 66.40 | 76.43 | 135.64 | 4 | 2 | 3 | 3 | 4 | 4 |
7 | LONGi LR6-60PE-310M 1 | Mono PERC | 125.40 | 75.57 | 66.24 | 65.58 | 75.79 | 134.69 | 3 | 4 | 5 | 5 | 5 | 5 |
20 | Phono PS380MH-24/TH | Mono PERC | – | – | 65.10 | 64.66 | 74.38 | 132.18 | – | – | 10 | 11 | 10 | 6 |
14 | Sample 2 | Mono PERC | 121.70 | 73.92 | 65.12 | 64.79 | 74.50 | 132.00 | 9 | 8 | 9 | 8 | 8 | 7 |
12 | NSP D6LM305E3A | Mono PERC | 120.30 | 72.17 | 63.80 | 63.79 | 74.54 | 131.73 | 13 | 14 | 14 | 14 | 7 | 8 |
10 | Recom RCM-275-6MB-4-BB21 | Mono | 123.30 | 74.09 | 65.31 | 65.06 | 74.62 | 131.72 | 6 | 7 | 6 | 7 | 6 | 9 |
8 | Aiduo AD280-60S | Mono | 121.50 | 74.13 | 65.04 | 64.69 | 74.18 | 131.71 | 10 | 6 | 11 | 10 | 11 | 10 |
4 | Perlight PLM-300M-60 | Mono PERC | 122.40 | 73.68 | 65.14 | 65.15 | 74.48 | 131.60 | 8 | 9 | 8 | 6 | 9 | 11 |
21 | Risen RSM120-6-320M | Mono PERC | – | – | – | – | – | 131.52 | – | – | – | – | – | 12 |
2 | Phono MWT-60-280 | Multi MWT | 123.60 | 73.15 | 63.52 | 62.76 | 72.64 | 131.19 | 5 | 11 | 15 | 15 | 14 | 13 |
3 | Risen RSM60-6-270P | Multi | 122.90 | 73.28 | 63.99 | 64.02 | 72.61 | 131.11 | 7 | 10 | 13 | 13 | 15 | 14 |
9 | Aiduo AD265-60P | Multi | 120.80 | 73.10 | 64.29 | 64.06 | 73.55 | 130.36 | 11 | 13 | 12 | 12 | 13 | 15 |
13 | Sample 1 | Mono | 120.30 | 73.12 | 65.26 | 64.76 | 73.62 | 128.56 | 12 | 12 | 7 | 9 | 12 | 16 |
Test cooperation
pv magazine test is a cooperation involving pv magazine, CEA and Gsolar. All testing procedures are carried out at Gsolar’s test laboratory in Xi’an, China. CEA supervises these tests and designed both the indoor and outdoor testing procedures.
Notes on the energy yield measurements:
- The energy yield is given in Wh/Wp and calculated by dividing the energy produced by the module by the Pmax at STC of the module. This Pmax is the maximum STC power after a process of stabilization.
- The results are grouped in categories, per module type.
- The bifacial boost depends on many parameters: the bifaciality factor, the installation geometry, the albedo of the ground, and also the sun angle and diffuse irradiance. The ground in this case is a plastic cover simulating green grass.
This content is protected by copyright and may not be reused. If you want to cooperate with us and would like to reuse some of our content, please contact: editors@pv-magazine.com.