
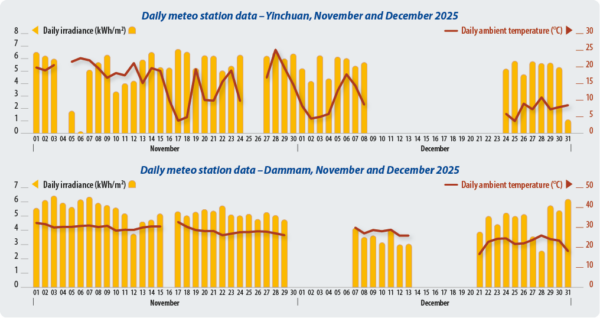
Notable testing disruptions occurred when the data transmission system malfunctioned on Nov. 4, 25 and 26, and the data were removed from the test site in Yinchuan, China. Samples installed before February 2025 were removed from the field on Dec. 9 for a power retest to evaluate their degradation after one year of operation. The samples were reinstalled after Dec. 22, except the Longi tunnel-oxide passivated contact (TOPCon) sample that was kept for further testing for performance evalutation. This module is not included in December performance data.
The test site in Dammam, Saudi Arabia, experienced various technical interruptions in November and December 2025. The field results for Nov. 16 and 30, as well as Dec. 1 to 6, 14 to 20, 16, and 30, have been excluded.
These gaps were caused by regional power outages in Dammam, scheduled work in the test field, and significant communication issues throughout December. Consequently, both meteorological and production records for these dates were removed to ensure the overall integrity of the dataset. Irradiance and temperature were slightly lower in November and December, but the relative performance of the products remained unchanged.
Monthly highlights
Despite three days of missing generation data, November’s energy yield from Yinchuan significantly outperformed October’s. This increase was driven by higher irradiance and more favorable (lower) operating temperatures. However, power retests conducted in December revealed that certain samples experienced higher-than-expected power loss. We have identified maximum power degradation as the primary factor behind the recent drop in performance ranking. A comprehensive analysis will be included in next month’s issue. George Touloupas and Huatian Xu
| # | Installation Month | Product | Type | Total 2025 November kWh/m2 |
Total 2025 November Wh/Wp |
November 2025 Rank (Wh/Wp) | Total 2025 December kWh/m2 |
Total 2025 December Wh/Wp |
December 2025 Rank (Wh/Wp) |
| 60 | 12/8/2024 | Runergy HY-DH144N8-570 | Bifacial n-TOPCon | 30.89 | 141.42 | 1 | 18.12 | 82.95 | 1 |
| 62 | 3/5/2025 | SEG Solar SEG-BTC-600-BG | Bifacial n-TOPCon | 31.05 | 140.50 | 1 | 18.28 | 82.69 | 1 |
| 66 | 6/5/2025 | AE AE605CMER-132-BDS | Bifacial n-TOPCon | 31.33 | 140.24 | 1 | 18.41 | 82.41 | 1 |
| 61 | 12/9/2024 | JA JAM72D42-615/LB | Bifacial n-TOPCon | 31.61 | 140.79 | 1 | 18.46 | 82.21 | 1 |
| 50 | 12/8/2024 | Astronergy CHSM72N(DG)/F-BH-580 | Bifacial n-TOPCon | 30.86 | 139.41 | 1 | 18.15 | 82.02 | 1 |
| 57 | 12/8/2024 | AE AE570CMD-144BDS | Bifacial n-TOPCon | 30.66 | 138.66 | 2 | 17.96 | 81.24 | 2 |
| 56 | 12/8/2024 | Longi LR5-72HGD-585M | Bifacial n-TOPCon | 31.10 | 138.43 | 2 | / | / | / |
| 63 | 3/5/2025 | Astronergy CHSM66RN(DG)/F-BH-615 | Bifacial n-TOPCon | 31.39 | 138.32 | 2 | 18.42 | 81.18 | 2 |
| 54 | 12/8/2024 | Trina TSM-685NEG21C.20 | Bifacial n-TOPCon | 30.75 | 138.07 | 2 | 18.02 | 80.92 | 2 |
| 58 | 12/8/2024 | SolarSpace SS9-66HD-695N | Bifacial n-TOPCon | 31.14 | 138.32 | 2 | 18.20 | 80.84 | 2 |
| 59 | 12/8/2024 | DMEGC DM605G12RT-B66HSW | Bifacial n-TOPCon | 30.47 | 137.72 | 2 | 17.85 | 80.65 | 2 |
| 53 | 1/1/2025 | SEG SEG-575-BTA-BG | Bifacial n-TOPCon | 30.85 | 136.22 | 3 | 18.07 | 79.80 | 3 |
| Specific energy yield ranking– Dammam, November and December 2025 | |||||||||
| # | Installation Month | Product | Type | Total 2025 November kWh/m2 | Total 2025 November Wh/Wp | November 2025 Rank (Wh/Wp) | Total 2025 December kWh/m2 | Total 2025 December Wh/Wp | December 2025 Rank (Wh/Wp) |
| 62 | 5/8/2025 | SEG Solar SEG-BTC-600-BG | Bifacial n-TOPCon | 35.39 | 159.15 | 1 | 18.69 | 84.07 | 1 |
| 63 | 5/8/2025 | Astronergy CHSM66RN(DG)/F-BH-615 | Bifacial n-TOPCon | 34.61 | 152.93 | 2 | 18.39 | 81.27 | 2 |

This content is protected by copyright and may not be reused. If you want to cooperate with us and would like to reuse some of our content, please contact: editors@pv-magazine.com.