
The importance of extensive third-party testing is well known. Lengthy and expensive stress tests are usually required to validate a product’s performance, in order for it to be accepted by various end users and to attain good market share further down the road.
Our test is not intended to substitute these “pro-level” tests, as it was designed to be economical, have a fast turnaround and, most importantly, present the test results using a “benchmarking” method with scores from 1 to 100, so that our readers would have a quick, user-friendly view of where each product stands in respect to its peers. The indoor tests have been designed and are being supervised by CEA, with Gsola performing the tests.
For each product, five samples are randomly selected from 2,000 serial numbers provided by the manufacturer, which then go through a series of chamber tests at Gsola’s laboratory, including visual and EL inspection, low irradiance loss test, Pmax temperature coefficient test, PID test, and, optionally, an LID test. The indoor tests are described in detail in the September 2017 issue of pv magazine, “Method for the modules”, and the grading system in the December 2017 issue, “Building the Benchmark”.
The outdoor performance test of PV modules is the single “real world” performance indicator that every buyer is most interested in. As part of the pv magazine test program, CEA designed the outdoor field setup and methodology. Gsola has prepared an outdoor installation field in Xi’an, China, on the rooftop of a building that houses its manufacturing facilities and the test lab where the tests are conducted.
Among the five selected samples for each product, one is installed on the rooftop of Gsola’s facility for the outdoor test, after being light soaked and stabilized. Refer to pv magazine’s June 2018 issue, “Capturing outdoor performance” for details.
Monthly test reports have been published since September 2018 and so far, we have covered results from June 2018 to April 2019. Now we think it is a good time to look at these extensive test data across a bigger time frame and find some interesting insights and investigate correlations between indoor tests and outdoor field performance.
Meteo data overview
Xi’an has a temperate climate, with cold winters and mildly humid, hot summers. The ambient daytime temperature and irradiance data are depicted in the chart to the left. Obviously, ambient daytime temperature and irradiance levels have a big impact on the energy yield of the solar modules. Later in this article, we will be filtering out some specific ambient temperature and irradiance conditions to investigate and compare different solar technologies’ performance.
Power cuts occurred on the following 15 days: June 3 to 5 and July 8, 9, 17 in 2018; and April 11 to 19 in 2019. Thus, the energy yield data from the above days are missing from our data set. If we exclude these 15 days, we have a total of 319 operating days’ data from June 2018 to April 2019.
On February 10 and 18, the bifacial boost spiked to 55% and 22%, respectively (normal range is 5%–10%). Our investigation of the CCTV footage identified snow coverage on the mono-facial modules on both days that brought down the mono-facial energy yield and resulted in an unusually high bifacial boost, which we define relative to the average performance of the monofacial modules.
Bifacial modules produce energy from the rear side even when covered, which results in faster snow shedding. This, together with the increased albedo of snowed grounds provides a big advantage to bifacial modules in snow. For the detailed test report, refer to pv magazine’s April 2019 issue, “pv magazine test – February 2019 Results”.
Energy yield by product
Daily energy yield data were collected for all 16 products. The total monthly energy yield is compared and ranked among all products, as shown in the table below. Bifacial and mono PERC products occupy the top three positions.
The table also reveals the testing period for each product: product one to 17 participated in the outdoor test from the beginning (June 2018) until now, whereas products 18, 20, and 21 were introduced into the outdoor test in October 2018, November 2019, and March 2019, respectively.
We can see that the 16 products involved in the outdoor test cover five cell technologies: bifacial N-PERT, bifacial mono PERC, mono PERC, mono, and multi. We decided to select the time frame for the test results’ analysis from March to April 2019, because this was the period when all 16 products were installed in the outdoor test field.
As shown in the chart below, the bifacial and mono PERC products outperform standard multi and mono technologies, which is consistent with the ranking indicated in the table. This is obviously due to the bifacial boost of the bifacial products. The performance of the bifacial N-PERT product from Jolywood is lagging slightly, but we need more products to attempt to draw general conclusions about technology performance.
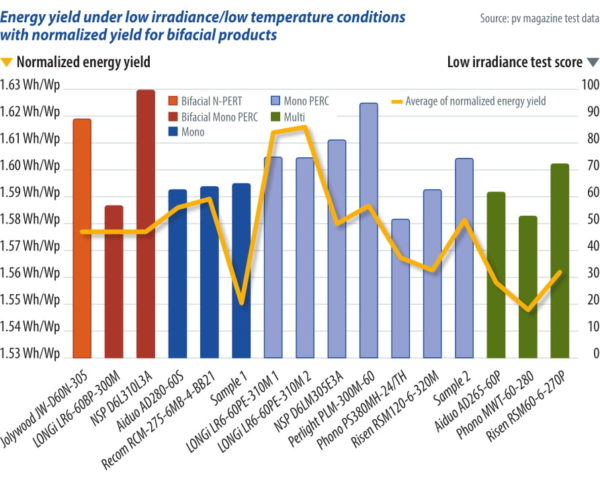
The energy yield under low irradiance and low temperature conditions was investigated and compared among all 16 products, as shown in figure 3. Days with irradiance of less than 2 kWh/m2 and ambient temperatures of less than 15 °C were selected for the analysis, which are the following five days: March 2, April 10, April 20, April 27, and April 28. To control variables when investigating different products’ performance under specific temperature and irradiance conditions, and also to compare bifacial products with mono-facial products more accurately, a normalized energy yield is calculated for the three bifacial products by dividing the energy yield by (1+ bifacial boost of the product).
The low irradiance efficiency test measures the relative efficiency loss at an irradiance of 200 W/m2, which is what one would get on a cloudy day. In the chart top left, the low irradiance efficiency test scores are plotted together with the low irradiance energy yield for these five days, averaged and grouped by technology.
The chart left shows that most mono PERC products, both monofacial and bifacial, outperform all other technologies under low irradiance conditions. This is particularly true for the Longi monofacial mono PERC products, and even for some of the standard mono products (Recom and Aiduo). Standard multi products are lagging.
However, we could not identify a strong correlation between the low irradiance test score and the energy yield under low irradiance conditions. We suspect that there may be other factors, such as different spectral sensitivity and quantum efficiency that play a role in this effect, and which we may further investigate in the future as we bring in more products for testing.
The energy yield under high temperature and high irradiance conditions was investigated and compared among all 16 products as shown in the middle chart on the left.
For our analysis, we selected days with an ambient temperature greater than 20 °C and an irradiance greater than 6 kWh/m2, which are the following eight days: March 20, March 28, April 4 to 7, April 24, and April 25. To factor out the impact of bifaciality on the energy yield, we used the same normalization method described in the previous section.
A PV module with a “steep” power temperature coefficient (high absolute value) will produce less energy in a hot climate compared to a module with a “flatter” dependency (low absolute value). The temperature coefficient test is designed to evaluate the product’s performance under hot climate: a low temperature coefficient score translates to less efficiency loss as the module’s temperature increases.
The bottom chart on the left shows that there is some, even if not so strong, correlation between the temperature coefficient test score and the energy yield.
Again, the two Longi monofacial products perform above all others and mono PERC is doing better than standard mono and multi. However, there are some aberrations, such as the not so great yield of the bifacial products, despite the fact that they have good test scores. This could be explained by their double glass construction, which has reduced ability to abduct heat compared to a glass-backsheet module. As we test more products, we will have more data to further analyze these differences.
Diffuse irradiance
The bifacial boost for the outdoor test is defined as the extra average energy yield of the bifacial products compared to the average energy yield of the monofacial products. In general, bifacial products outperform the monofacial products when the diffuse irradiance level is high. Days with irradiance of less than 2 kWh/m2 and a temperature less than 5 °C were selected for this analysis.
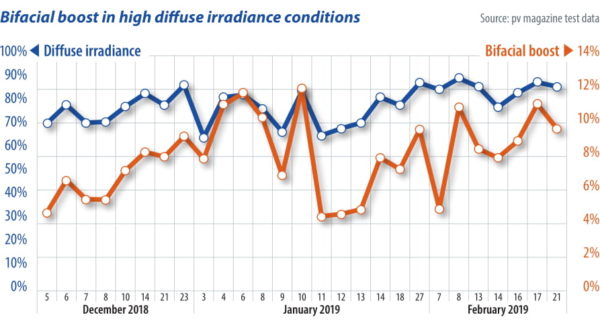
As shown in chart top left, the bifacial boost is positively related to the percentage of diffuse irradiance over the total irradiance. The explanation is that high diffuse irradiance has a higher impact on the rear side yield, whereas strong direct irradiance has a higher impact on the front side yield.
As our test program has gained more traction over the past 11 months, we are in the process of enhancing it to keep up with the latest technology development and emerging hot topics in the solar industry.
At the same time, we are actively engaging more top tier manufacturers to participate in our test program. As we install more samples and gather more datapoints, we will have a better opportunity to deepen our analysis and provide more interesting insights to our readers.
Authors: George Touloupas, Chi Zhang
Table 1: Energy yield ranking – June 2018 to April 2019 | ||||||||||
# | Product | Type | Jun to Oct 2018 Wh/Wp | Total Nov 2018 Wh/Wp | Dec 2018 to Feb 2019 Wh/Wp | Mar to Apr 2019 Wh/Wp | Jun to Oct 2018 rank | Nov 2018 rank | Dec to Feb 2019 rank | Mar to Apr 2019 rank |
1 | Jolywood JW-D60N-305 | Bifacial N-PERT | 124.21 | 75.44 | 70.30 | 111.76 | 2 | 5 | 3 | 3 |
2 | Phono MWT-60-280 | Multi | 119.55 | 73.15 | 66.30 | 106.42 | 5 | 11 | 15 | 13 |
3 | Risen RSM60-6-270P | Multi | 119.00 | 73.28 | 66.87 | 106.28 | 8 | 10 | 14 | 14 |
4 | Perlight PLM-300M-60 | Mono PERC | 119.52 | 73.68 | 68.26 | 106.77 | 6 | 9 | 7 | 12 |
7 | LONGi LR6-60PE-310M 1 | Mono PERC | 122.10 | 75.57 | 69.20 | 109.27 | 3 | 4 | 5 | 5 |
8 | Aiduo AD280-60S | Mono | 117.90 | 74.13 | 67.97 | 106.82 | 11 | 6 | 10 | 10 |
9 | Aiduo AD265-60P | Multi | 118.13 | 73.10 | 67.30 | 105.78 | 10 | 13 | 13 | 15 |
10 | Recom RCM-275-6MB-4-BB21 | Mono | 119.46 | 74.09 | 68.33 | 106.83 | 7 | 7 | 6 | 9 |
12 | NSP D6LM305E3A | Mono PERC | 117.64 | 72.17 | 67.37 | 106.79 | 12 | 14 | 12 | 11 |
13 | Sample 1 | Mono | 115.38 | 73.12 | 67.88 | 104.18 | 13 | 12 | 11 | 16 |
14 | Sample 2 | Mono PERC | 118.54 | 73.92 | 68.14 | 107.11 | 9 | 8 | 8 | 7 |
16 | LONGi LR6-60PE-310M 2 | Mono PERC | 121.30 | 76.57 | 69.96 | 110.06 | 4 | 2 | 4 | 4 |
17 | NSP D6L310L3A | Bifacial Mono PERC | 124.96 | 76.51 | 70.98 | 112.61 | 1 | 3 | 2 | 2 |
18 | LONGi LR6-60BP-300M | Bifacial Mono PERC | – | 78.74 | 72.71 | 115.94 | – | 1 | 1 | 1 |
20 | Phono PS380MH-24/TH | Mono PERC | – | – | 68.05 | 107.24 | – | – | 9 | 6 |
21 | Risen RSM120-6-320M | Mono PERC | – | – | – | 106.86 | – | – | – | 8 |
Test cooperation
pv magazine test is a cooperation involving pv magazine, CEA and Gsolar. All testing procedures are carried out at Gsolar’s test laboratory in Xi’an, China. CEA supervises these tests and designed both the indoor and outdoor testing procedures.
Notes on the energy yield measurements:
- The energy yield is given in Wh/Wp and calculated by dividing the energy produced by the module by the Pmax at STC of the module. This Pmax is the maximum STC power after a process of stabilization.
- The results are grouped in categories, per module type.
- The bifacial boost depends on many parameters: the bifaciality factor, the installation geometry, the albedo of the ground, and also the sun angle and diffuse irradiance. The ground in this case is a plastic cover simulating green grass.
This content is protected by copyright and may not be reused. If you want to cooperate with us and would like to reuse some of our content, please contact: editors@pv-magazine.com.