New bifacial tunnel oxide passivated contact (TOPCon) products from Astronergy, HY Solar, Trina Solar and a back contact product from Aiko were installed in the outdoor test field on Sep. 1. We removed this day from the results so that these modules can be ranked together. A back contact product from Longi and a heterojunction (HJT) product from Risen are going through indoor testing and we expect to add them to the outdoor test installation shortly.
We observed that the energy yield figures of several top-performing products are very close and this may render the numbered ranking method we have been using less meaningful. CEA is working on a new ranking system that will adapt to these new trends and be more representative of product performance.
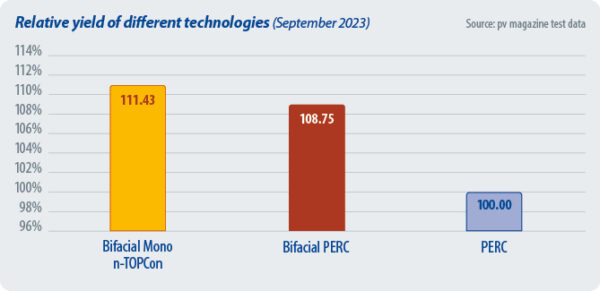
The average bifacial boost was 9.16% for September 2023. Bifacial boost is defined as the relative advantage of the average specific energy yield of all bifacial products compared to the average specific energy yield of all monofacial mono passivated emitter rear contact (PERC) products. As more TOPCon bifacial products have been installed recently, we decided to begin reporting the bifacial boost figures for PERC and TOPCon solar separately, in addition to the overall bifacial boost.
Bifacial boost
| All in Wh/Wp | Total June 2023 | Total July 2023 | Total Aug. 2023 | Total Sep. 2023 |
|---|---|---|---|---|
| Average monthly yield | 124.06 | 124.66 | 133.43 | 103.62 |
| Average monthly bifacial yield | 133.34 | 134.30 | 142.29 | 108.65 |
| Average monthly monofacial PERC yield | 119.80 | 120.42 | 129.12 | 99.28 |
| Operation days | 26 | 29 | 23 | 29 |
| Average daily yield | 4.77 | 4.05 | 5.80 | 3.57 |
| Average daily bifacial yield | 5.13 | 4.39 | 6.19 | 3.75 |
| Average daily monofacial PERC yield | 4.61 | 3.90 | 5.61 | 3.42 |
| Bifacial TOPCon boost | N/A | N/A | N/A | 10.88% |
| Bifacial PERC boost | N/A | N/A | N/A | 8.21% |
| All technologies bifacial boost | 11.30% | 11.01% | 10.20% | 9.16% |
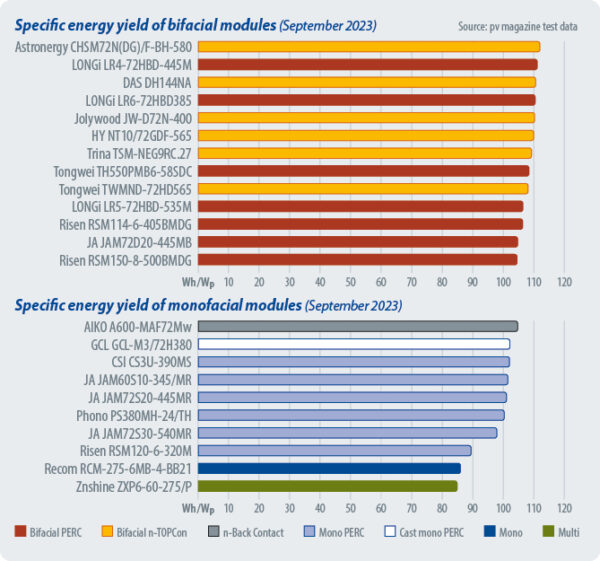
Specific energy yield ranking of bifacial modules – historical
| # | Installation month | Product | Type | Sample selection method | Total June 2023 Wh/Wp | Total July 2023 Wh/Wp | Total Aug. 2023 Wh/Wp | Total Sep. 2023 Wh/Wp | June 2023 Rank | July 2023 Rank | Aug. 2023 Rank | Sep. 2023 Rank |
|---|---|---|---|---|---|---|---|---|---|---|---|---|
| 50 | 2023/9/1 | Astronergy CHSM72N(DG)/F-BH-580 | Bifacial N-TOPCon | 3 | / | / | / | 112.05 | / | / | / | 1 |
| 37 | 2021/5/1 | LONGi LR4-72HBD-445M | Bifacial PERC | 3 | 137.06 | 137.27 | 146.60 | 111.11 | 2 | 2 | 1 | 2 |
| 42 | 2023/6/5 | DAS-DH144NA-570 | Bifacial N-TOPCon | 3 | 138.07 | 139.49 | 146.49 | 110.65 | 1 | 1 | 2 | 3 |
| 26 | 2019/8/28 | LONGi LR6-72HBD375 | Bifacial PERC | 1 | 136.22 | 136.22 | 145.67 | 110.44 | 4 | 4 | 4 | 4 |
| 27 | 2019/12/31 | Jolywood JW-D72N-400 | Bifacial N-TOPCon | 3 | 136.78 | 136.84 | 145.78 | 110.31 | 3 | 3 | 3 | 5 |
| 47 | 2023/9/1 | HY NT10/72GDF-565 | Bifacial N-TOPCon | 3 | / | / | / | 110.01 | / | / | / | 6 |
| 45 | 2023/8/15 | Trina TSM-NEG9RC.27 | Bifacial N-TOPCon | 3 | / | / | / | 109.31 | / | / | / | 7 |
| 41 | 2022/12/18 | Tongwei TH550PMB6-58SDC | Bifacial PERC | 1 | 133.10 | 134.44 | 140.75 | 108.40 | 5 | 5 | 6 | 8 |
| 43 | 2023/6/23 | Tongwei TWMND-72HD565 | Bifacial N-TOPCon | 3 | / | / | 143.57 | 108.18 | / | / | 5 | 9 |
| 38 | 2021/11/20 | LONGi LR5-72HBD-535M | Bifacial PERC | 3 | 130.89 | 131.15 | 139.65 | 106.44 | 6 | 6 | 8 | 10 |
| 28 | 2020/4/15 | Risen RSM114-6-405BMDG | Bifacial PERC | 3 | 130.86 | 130.56 | 139.89 | 106.36 | 7 | 7 | 7 | 11 |
| 34 | 2021/7/1 | JA JAM72D20-445MB | Bifacial PERC | 2 | 128.60 | 128.72 | 137.36 | 104.73 | 8 | 8 | 9 | 12 |
| 32 | 2021/7/1 | Risen RSM150-8-500BMDG | Bifacial PERC | 1 | 128.48 | 128.76 | 137.13 | 104.54 | 9 | 9 | 10 | 13 |
Specific energy yield ranking of monofacial modules – historical
| # | Installation month | Product | Type | Sample selection method | Total June 2023 Wh/Wp | Total July 2023 Wh/Wp | Total Aug. 2023 Wh/Wp | Total Sep. 2023 Wh/Wp | June 2023 Rank | July 2023 Rank | Aug. 2023 Rank | Sep. 2023 Rank |
|---|---|---|---|---|---|---|---|---|---|---|---|---|
| 44 | 2023/9/1 | AIKO A600-MAF72Mw | N-back contact | 3 | / | / | / | 104.79 | / | / | / | 1 |
| 30 | 2020/7/7 | GCL GCL-M3/72H380 | Cast PERC | 1 | 123.00 | 123.20 | 133.26 | 102.23 | 2 | 2 | 1 | 2 |
| 29 | 2020/7/7 | CSI CS3U-390MS | PERC | 2 | 123.32 | 123.44 | 132.83 | 102.12 | 1 | 1 | 2 | 3 |
| 31 | 2020/10/1 | JA JAM60S10-345/MR | PERC | 2 | 122.23 | 121.70 | 131.09 | 101.57 | 4 | 4 | 4 | 4 |
| 35 | 2021/7/1 | JA JAM72S20-445MR | PERC | 2 | 122.62 | 122.85 | 131.80 | 101.13 | 3 | 3 | 3 | 5 |
| 20 | 2018/11/21 | Phono PS380MH-24/TH | PERC | 1 | 120.47 | 120.72 | 130.80 | 100.39 | 5 | 5 | 5 | 6 |
| 36 | 2021/11/20 | JA JAM72S30-540MR | PERC | 2 | 119.12 | 119.41 | 127.13 | 97.98 | 6 | 6 | 6 | 7 |
| 21 | 2019/3/1 | Risen RSM120-6-320M | PERC | 1 | 107.81 | 106.27 | 116.96 | 89.54 | 7 | 7 | 7 | 8 |
| 10 | 2018/5/24 | Recom RCM-275-6MB-4-BB21 | Mono | 1 | 98.65 | 96.20 | 105.36 | 86.05 | 8 | 8 | 8 | 9 |
| 22 | 2019/5/4 | Znshine ZXP6-60-275/P | Multi | 1 | 95.82 | 93.70 | 102.95 | 84.92 | 9 | 9 | 9 | 10 |
Notes on the energy yield measurements:
- The energy yield comparison among various technologies, including bifacial boost, will be analyzed using products installed after the beginning of 2019.
- The energy yield is given in Wh/Wp and calculated by dividing the energy produced by the module by the maximum power point (Pmax) at standard test conditions (STC) of the module. This Pmax is the maximum STC power after a process of stabilization.
- The results are grouped in categories, per module type.
- The bifacial boost depends on many parameters: the bifaciality factor, the installation geometry, the albedo of the ground, and the sun angle and diffuse irradiance. The ground in this case is gray gravel.
Test cooperation
pv magazine test is a cooperative effort involving pv magazine, APsystems, CEA, and Gsolar. All testing procedures are carried out at Gsolar’s test laboratory in Xi’an, China. CEA supervises these tests and designed both the indoor and outdoor testing procedures.
This content is protected by copyright and may not be reused. If you want to cooperate with us and would like to reuse some of our content, please contact: editors@pv-magazine.com.