The fastest energy change in history
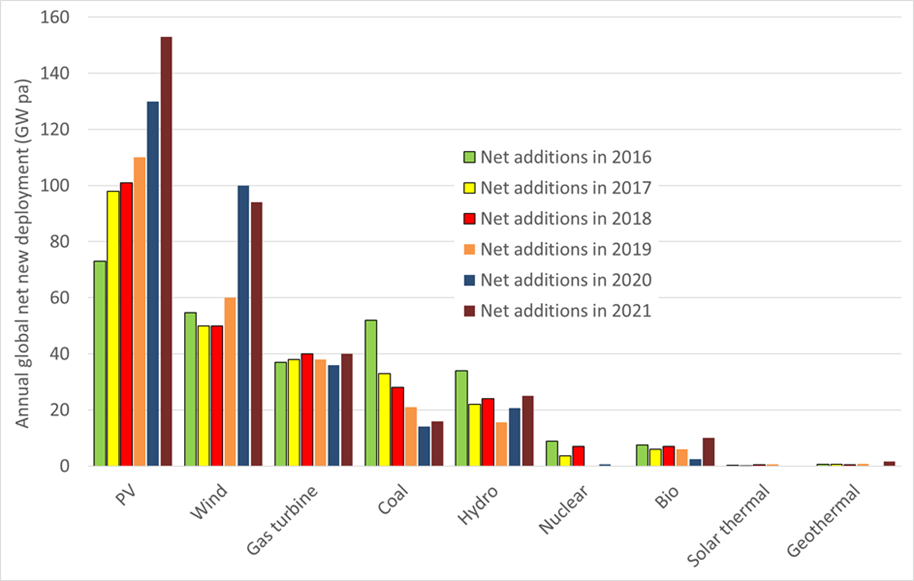
This market dominance means that solar and wind are replacing coal and gas generators. They are also meeting much of the rising demand for electricity, which is growing three times faster (2.7% per year over the 2011-21 period) than the global population.
Soon there will be large-scale electrification of transport, heating and industry – the “electrification of everything,” or the comeback of “tout-électrique.” This will lead to double or triple demand for electricity. Solar and wind will also meet this new load.
Image: ISES
Fossil fuels cause three-quarters of global greenhouse gas emissions. But in most countries, solar and wind are being installed at a much faster rate than new coal plants (Figure 2). Excluding China, global coal capacity has been falling for several years, as older power stations shut down faster than new power stations open. The paucity of new coal capacity means that the world is at peak coal.
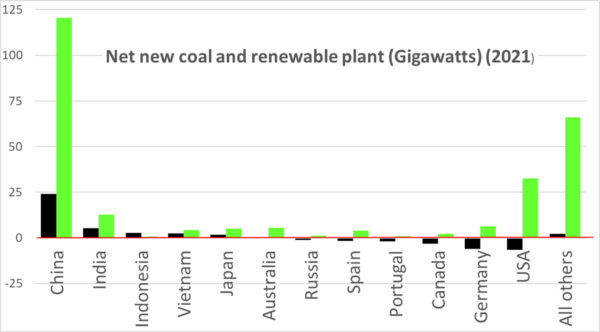
Image: ISES
Solar and wind have passed 1 TW of installed capacity. The deployment of PV and wind is increasing exponentially. Cumulative installed solar capacity will overtake wind soon.
Global installed solar capacity has grown by a factor of 500 over the past 20 years. In 1985, when the current PV industry workhorse, PERC technology, was still an innovation that would take another 20 years to flourish, the total annual production of PV modules was less than 25 MWp. Today, many of the individual Tier 1 PV module manufacturers produce 25 MWp/day.
The growth rate in annual deployment rate in recent years has been about 18%. Projecting this growth rate forward shows that installed solar capacity will pass the combined total of nuclear, hydro, gas and coal in 2031 (Figure 3).
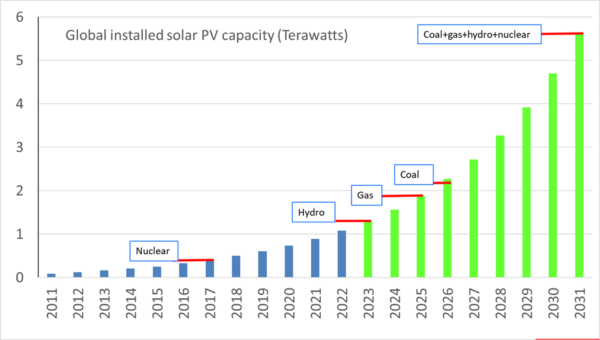
Image: ISES
Electricity consumption in developed regions such Europe, North America, Japan and Australia has reached between 7 MWh and 15 MWh per person per year. The electrification of transport, heating and industry to get rid of fossil fuels involves a doubling of electricity demand or more, depending on a country’s participation in the chemical industry. Electricity consumption in developed countries could therefore hit 20 MWh per person per year by the middle of the century.
The global population in mid-century is projected to be about 10 billion people. An affluent and fully electrified global economy with zero fossil fuels will therefore require about 200,000 TWh of electricity per year.
Solar has a far larger resource base than any other generation source and will have to provide most future energy – for example, 60% of total future energy, or 120,000 TWh. This equates to a requirement for about 75 TW of solar, assuming an average capacity factor of 18%. We need to reach an annual installation rate of 4 TW per year by the mid-2030s to achieve this by the middle of the century. The current growth rate in annual PV deployment is nearly enough to achieve this.
Global pathfinding is important to show what is possible. Australia is generating twice as much solar electricity per capita than any other gigawatt-scale electricity system (Figure 4). The government target for the National Electricity Market for 2030 is 82% renewable electricity (mostly solar and wind).
Australia is located at a low-moderate latitude, along with most of the global population. Australia is demonstrating that the rapid deployment of solar and wind is compatible with affordable electricity prices and a stable electricity grid.
Large-scale energy storage in the form of pumped hydro energy storage is an off-the-shelf, low-cost, low-impact technology that has already been deployed at a scale of 200 GW. It is available at unlimited scale nearly everywhere.
The ANU Global PHES Atlas lists 616,000 off-river (closed loop) sites with a combined storage capacity of 23 million GWh, which is about 50 times more than needed to support a global 100% renewable energy system.
In response to the rapid rise of solar and wind, the Australian government has announced 15 GW of pumped hydro storage, which is far more than any other country on a per capita basis.
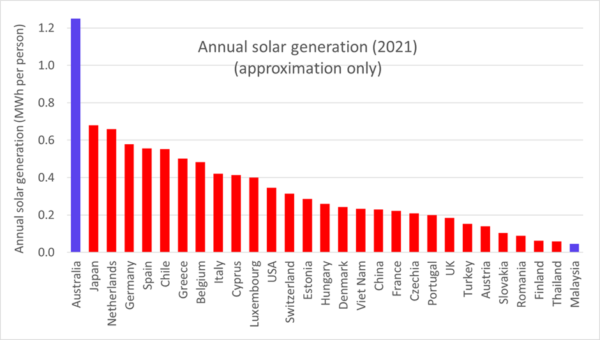
Image: ISES
January 25, 2023 PV Strategy Committee, International Solar Energy Society (ISES).
Authors: Prof. Andrew Blakers /ANU) & Prof. Ricardo Rüther (UFSC).
[email protected] and [email protected]
ISES, the International Solar Energy Society is an UN-accredited membership NGO founded in 1954 working towards a world with 100% renewable energy for all, used efficiently and wisely.

The views and opinions expressed in this article are the author’s own, and do not necessarily reflect those held by pv magazine.
This content is protected by copyright and may not be reused. If you want to cooperate with us and would like to reuse some of our content, please contact: [email protected].
Please login to comment

[…] cambio energético más rápido de la historia está en marcha. La nueva capacidad de generación de energía solar fotovoltaica se está […]
[…] cambio energético más rápido de la historia está en marcha. La nueva capacidad de generación de energía solar fotovoltaica se está […]
[…] cambio energético más rápido de la historia está en marcha. La nueva capacidad de generación de energía solar fotovoltaica se está […]
[…] PV Magazine proiectele fotovoltaice și eoliene sunt instalate la o rată de trei ori mai rapidă decât toate […]
[…] the locale to determine proper taxation. This has caused some uncertainty in the industry, however, solar is one of the fastest growing sectors of our nation’s […]
[…] half of all new generation capacity being installed around the world. See this short article: https://www.pv-magazine.com/2023/01/25/the-fastest-energy-change-in-history/Martin Green – Although the best commercial PERC modules are 21.6% efficient, our team at UNSW […]
[…] ISES pv journal column in April showed that the fastest vitality trade in history is continuing. In 2023, picture voltaic and wind together constituted 80% of world secure energy […]