U.S. solar has less thanks to give, as El Niño pattern develops

This Thanksgiving weekend sees skies over North America begin to show their characteristic winter-time El Niño signature, adding weight to expectations of depressed solar production across large areas of the continent, according to Solcast, a DNV company.
El Niño events, which see much warmer waters in the tropical eastern Pacific Ocean, tend to cause an extended subtropical Pacific jet stream, leading to increased cloud across the southern and central United States.
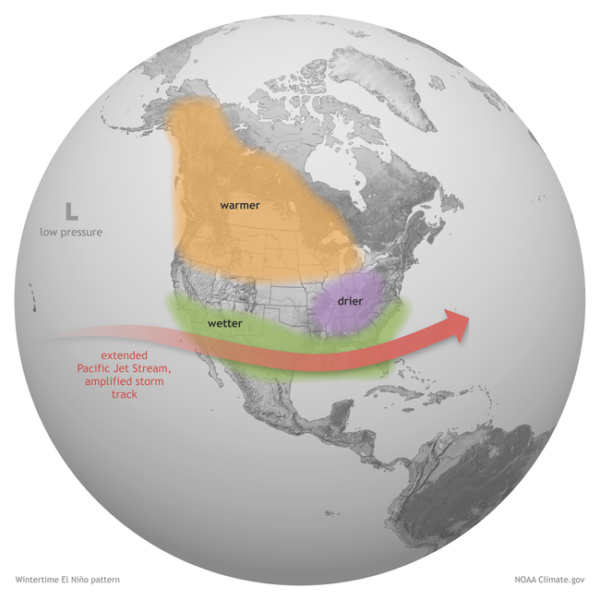
Source: NOAA
As a result of these atmospheric changes, during El Niño winters large areas of the continental US have a tendency to experience reduced irradiance. California, the Southwest, Midwest, Southeast, and Mexico in particular see cloudier conditions compared to average. Conversely, large areas of the Pacific Northwest and Canada tend to receive above-average irradiance.
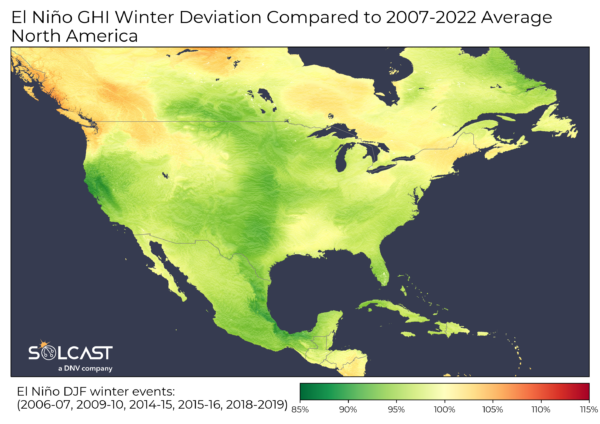
Image: Solcast
This November, weather patterns have started to resemble the characteristic El Niño signature, with low pressure in the northwest Pacific, and an enhanced subtropical jet stream spreading from the Pacific across the southern United States.
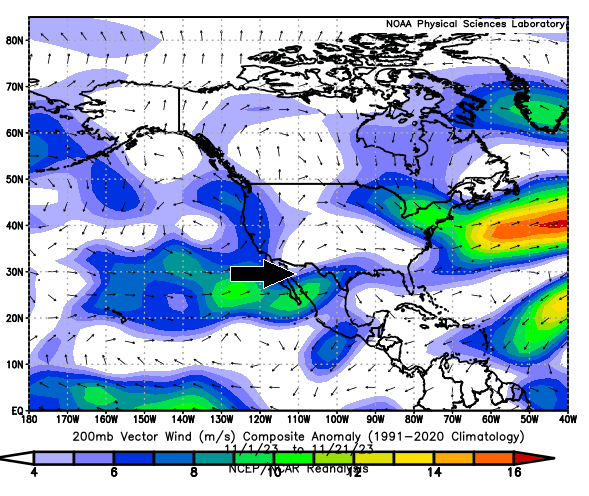
Source: NOAA
This weekend, we are seeing the beginnings of this El Niño type pattern in the Jet Stream, with an enhanced subtropical jet stream across the south and southeast of the continent.
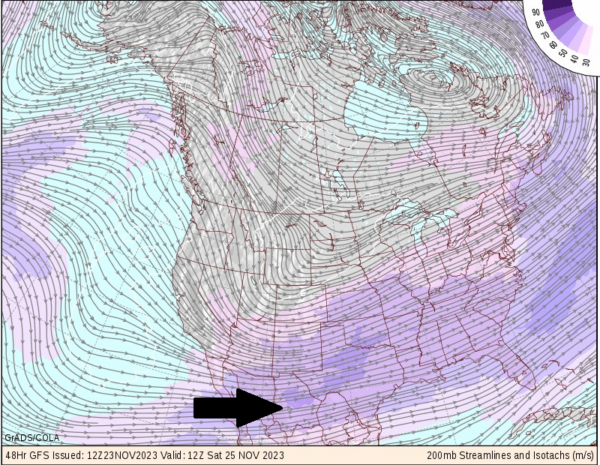
Source: NOAA
This weekend’s enhanced jet stream is sweeping high cloud from Mexico across the South of the US. As the jet stream accelerates, the atmosphere becomes unstable, causing low pressure to build up cloud over the Rockies and Midwest regions.
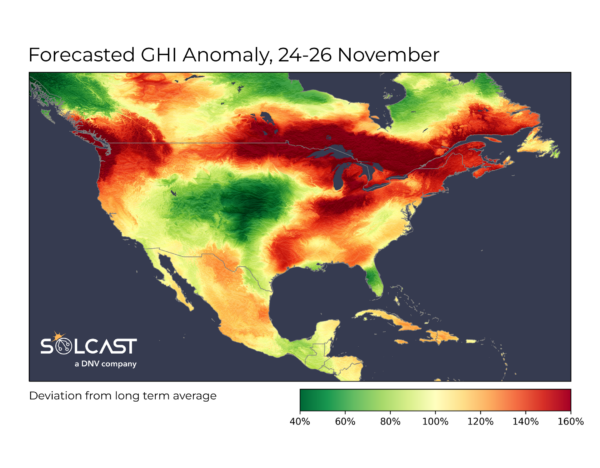
Image: Solcast
Solcast produces these figures by tracking clouds and aerosols at 1-2km resolution globally, using satellite data and proprietary AI/ML algorithms. This data is used to drive irradiance models, enabling Solcast to calculate irradiance at high resolution, with a typical bias of less than 2%, and also cloud-tracking forecasts. This data is used by more than 300 companies managing over 150 GW of solar assets globally.
The views and opinions expressed in this article are the author’s own, and do not necessarily reflect those held by pv magazine.
This content is protected by copyright and may not be reused. If you want to cooperate with us and would like to reuse some of our content, please contact: [email protected].
Please login to comment