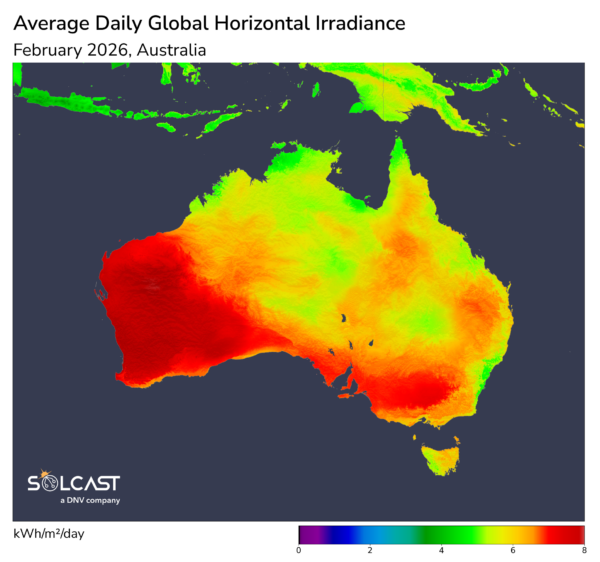
Australia closed out summer under contrasting weather patterns, as its wettest February since 2011 drove substantial reductions in irradiance across most of the continent, while Western Australia experienced markedly brighter conditions, according to analysis using the Solcast API.
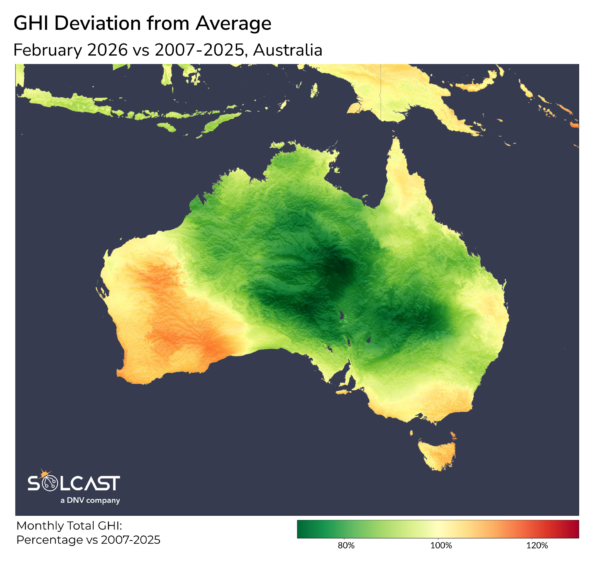
Across broad central and eastern regions, a persistent low‑pressure system drew warm tropical air deep inland, producing heavy rainfall, widespread cloud cover and February 2026 irradiance deficits of 15–30% across central and eastern regions, with the most severe reductions concentrated inland. Daily rainfall totals exceeded normal values by more than 5 mm across large areas, with some locations recording anomalies closer to 8 mm.
The Northern Territory saw an early-month tropical low intensify into Severe Tropical Cyclone Mitchell (Category 3) by February 7, bringing widespread rainfall, thunderstorms, and strong winds before dissipating on February 11. One station in Glinockie recorded 183 mm on February 2, its highest daily total on record. Central Australia was particularly impacted by increased rainfall, with some inland areas recording rainfall totals in February that rivalled their typical annual averages. These conditions were driven by the broader low-pressure system drawing tropical moisture inland, rather than the cyclone itself, which tracked along the northern coast. Queensland also endured persistent heavy rainfall and episodes of flooding, maintaining widespread cloud cover that reduced solar resource across the state.
Meanwhile, Western Australia experienced a markedly different end to summer. With tropical moisture diverted eastward, the state instead received cool, dry air masses arriving from the Southern Ocean. These conditions subdued cloud formation, allowing consistent sunshine and below‑average rainfall across most regions. Cloud cover remained sporadic, supporting the state’s irradiance increase of more than 10% above average for the month. The Pilbara was the notable exception, where Cyclone Mitchell brought strong winds and heavy rainfall along the coast, but even this event did not offset the broader sunny conditions experienced across the state.
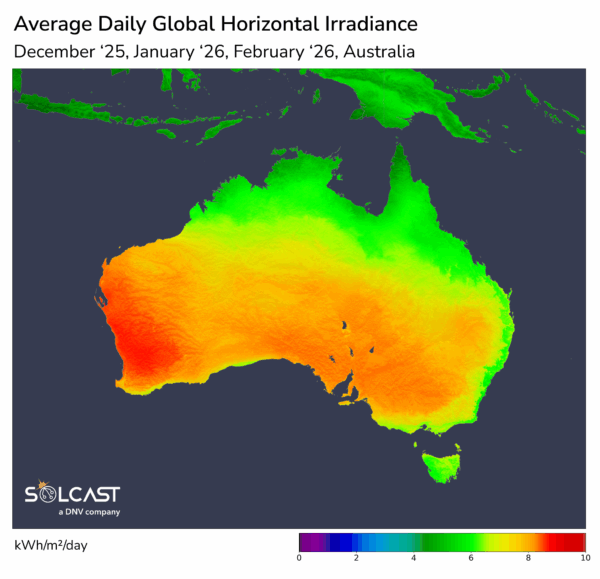
Across the broader summer season, February aligned with established conditions in Western Australia, Queensland, the Northern Territory and Tasmania, but was an outlier for southeastern Australia. The same low-pressure pattern influenced both January and February, shaping a wetter-than-average summer across Queensland and the Northern Territory, with Queensland recording its wettest summer since 2011 — including an exceptional 414 mm recorded at Innisfail on December 31, the highest daily total of the season. Nationally, rainfall was 32% above the long-term average. However, New South Wales, Victoria, and South Australia experienced relatively dry conditions earlier in the season, leading to a strong early summer for solar production. Those conditions flipped for Eastern Australia’s major utility-scale solar regions, with February’s cloudier and wetter pattern a departure from their summer trend.
The contrast is captured in Sydney and Perth — two cities that entered summer under similar conditions but diverged sharply in February. Sydney's solar resource dropped from 6% above average in January to 9% below in February, while Perth strengthened to 8% above average as dry Southern Ocean air kept skies clear.

Solcast produces these figures by tracking clouds and aerosols at 1-2km resolution globally, using satellite data and proprietary AI/ML algorithms. This data is used to drive irradiance models, enabling Solcast to calculate irradiance at high resolution, with typical bias of less than 2%, and also cloud-tracking forecasts. This data is used by more than 350 companies managing over 350 GW of solar assets globally.
The views and opinions expressed in this article are the author’s own, and do not necessarily reflect those held by pv magazine.
This content is protected by copyright and may not be reused. If you want to cooperate with us and would like to reuse some of our content, please contact: editors@pv-magazine.com.

By submitting this form you agree to pv magazine using your data for the purposes of publishing your comment.
Your personal data will only be disclosed or otherwise transmitted to third parties for the purposes of spam filtering or if this is necessary for technical maintenance of the website. Any other transfer to third parties will not take place unless this is justified on the basis of applicable data protection regulations or if pv magazine is legally obliged to do so.
You may revoke this consent at any time with effect for the future, in which case your personal data will be deleted immediately. Otherwise, your data will be deleted if pv magazine has processed your request or the purpose of data storage is fulfilled.
Further information on data privacy can be found in our Data Protection Policy.