
November brought significantly better solar conditions than average for this time of year across India. Northern regions basked in unusually clear skies, while the south endured cloud cover and severe storms. Cyclone Ditwah compounded the divide with significant impacts on solar generation and supporting infrastructures, according to analysis using the Solcast API.

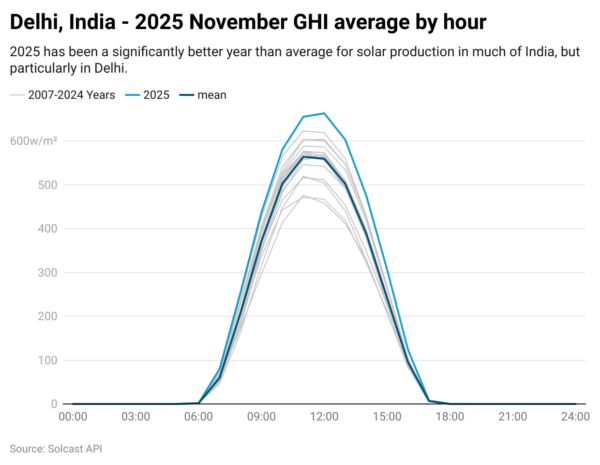
Northern India and Pakistan experienced a notably sunny November, with irradiance levels to 20% or more above the November norm, driven by a persistent high-pressure system that reached from Western China into Uzbekistan. This system stabilized the atmosphere, suppressing cloud formation, allowing for extended periods of uninterrupted sunlight across northern latitudes.
In contrast, southeastern India and Sri Lanka saw irradiance levels fell by 15–20% below seasonal norms due to cloud cover and intense rainfall driven by low-pressure system over the Bay of Bengal. This system ultimately led to the development of Cyclone Ditwah late in the month, compounding the impacts on irradiance with widespread community impacts.
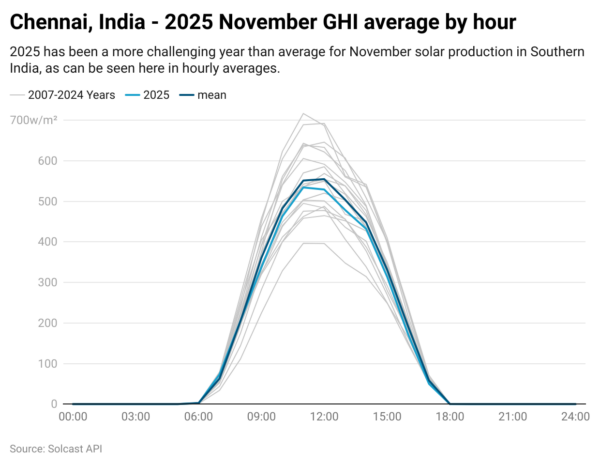
The cyclone first struck Sri Lanka, delivering the worst flooding the country has experienced in two decades. The UN estimates up to one million people were affected, with over 330 confirmed fatalities. After lashing Sri Lanka, Ditwah moved north to India, travelling along the southeastern coast and weakening into a deep depression as it progressed inland. Tamil Nadu, Andhra Pradesh, and Kerala bore the brunt of the storm, suffering from intense rain, high winds, and the destruction of key infrastructure, including farmlands and transport networks. For solar operators in these regions, the combination of heavy cloud cover and storm damage significantly limited generation potential.

Despite the severe weather events in the south, India saw a surge in renewable energy share in November. While overall electricity demand fell – driven by unseasonably cool temperatures in central regions – renewable sources made up a larger share of the generation mix. Coal generation declined by nearly 6% compared to November 2024, while renewable output rose 24% year-on-year. This increase is attributed to both the expansion of installed capacity and favourable solar conditions in northern India.
Solcast produces these figures by tracking clouds and aerosols at 1-2km resolution globally, using satellite data and proprietary AI/ML algorithms. This data is used to drive irradiance models, enabling Solcast to calculate irradiance at high resolution, with typical bias of less than 2%, and also cloud-tracking forecasts. This data is used by more than 350 companies managing over 300 GW of solar assets globally.
The views and opinions expressed in this article are the author’s own, and do not necessarily reflect those held by pv magazine.
This content is protected by copyright and may not be reused. If you want to cooperate with us and would like to reuse some of our content, please contact: editors@pv-magazine.com.


By submitting this form you agree to pv magazine using your data for the purposes of publishing your comment.
Your personal data will only be disclosed or otherwise transmitted to third parties for the purposes of spam filtering or if this is necessary for technical maintenance of the website. Any other transfer to third parties will not take place unless this is justified on the basis of applicable data protection regulations or if pv magazine is legally obliged to do so.
You may revoke this consent at any time with effect for the future, in which case your personal data will be deleted immediately. Otherwise, your data will be deleted if pv magazine has processed your request or the purpose of data storage is fulfilled.
Further information on data privacy can be found in our Data Protection Policy.