The intention to launch an outdoor test as part of the pv magazine test program was announced back in September 2017. However, it took several months to gather enough products to install in the test field, and, most importantly, to carefully design it, troubleshoot several problems, and ensure that the measurement results will be accurate.
Each product will be installed in the test field for a 12 month period, and its energy yield (kWh/kWp) will be monitored and measured. Dedicated areas have been designed for the monitoring of bifacial modules. The methodology and reasoning is described in detail below.
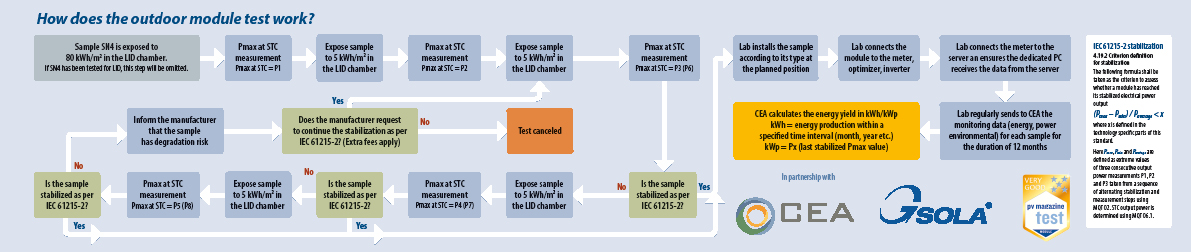
Testing process
The test process, as shown in the flowchart below, is fairly simple, but takes great care in stabilizing the sample using the method described in the 2016 edition of
IEC 61215-2, section 4.19. This is an important step, as the new standard sets more rigorous processes to ensure that the effect of the initial degradation of the sample due to light exposure will not affect the energy yield measurements performed. In the case that the sample continues to degrade after several cycles of light soaking, the manufacturer is notified, as the test may have to be aborted.
The final Pmax at standard test conditions (STC) – the maximum power point (MPP) measurement – will be used as the kWp value to calculate the energy yield (kWh/kWp) over a specific time period (month, week, or other). The energy yield is the ratio of kWh produced over the kWp of the module. We decided not to use the nominal nameplate power of the PV module in this calculation, as this would compromise the value of the test results. The actual Pmax values typically vary significantly during production and follow a bell curve distribution. The standard industry practice is to have 5 W of positive tolerance when defining the nameplate power, for example a module with a nameplate power of 300 W has been measured at the factory and had a Pmax between 300 and 304.99 W. If we used the nameplate power for the energy yield calculation, it would be easy for a manufacturer to affix a lower nameplate of, for example, 295 W, and artificially influence the Energy Yield upwards to their benefit. Our method of using the last stabilized Pmax value is the best way to assess the energy yield, filtering out any influences caused by Pmax and light-induced degradation fluctuations.
Measurement method
Designing the measurement method was the most challenging step, as the accurate energy production measurement is the most critical step. In order to make the modules operate at maximum power and channel the produced energy into the grid, we decided to install Huawei’s module level optimizers (model SUN2000P-375W) and connect them to the grid-connected Huawei inverter (SUN2000L-5KTL model). Each module is connected to the optimizer via a meter that captures the voltage and current values of each module every few seconds. The meter’s precision class is 0.5. As each module is connected to the same, high quality type of optimizer, this configuration ensures that all modules operate at MPP, their maximum current and voltage values are sampled frequently and accurately, and therefore their energy production measurements can be calculated with precision and compared with confidence. The meters and optimizers are installed in a cabinet, as shown in the image at the top of p. 101. The schematic diagram of the system configuration can be seen in the image below left. The meters are connected to a server and the values are streamed to a PC with dedicated monitoring software.
Outdoor field
The outdoor field is located at the rooftop of the building where Gsolar’s facilities are housed, as seen in the middle image on p. 101. Gsolar already has a rooftop PV installation, and the location of the pv magazine test field is marked with colored rectangles. The position of the test field has been chosen so that there is no shading from adjacent buildings or superstructures at any time of the year. It has also been centered in the middle of the array, so that there are no edge effects such as wind shading and temperature non-uniformities. The bifacial modules will be installed at the rear row (green rectangle) and the floor will be treated with a uniform layer of grey paint, of similar hue to the existing concrete floor, to ensure that the bifacial test modules are exposed to a uniform ground albedo. A weather station monitors irradiance (global, direct, and diffuse), ambient temperature, and wind speed and direction. The data are recorded and will be used for informational purposes to assess seasonal performance variations of the test modules.
Test results
The outdoor test field has been finalized and came online in May. After an initial pilot period to solve any irregularities, the monitoring data will start being collected and recorded in the official test log. The first results will be available for the month of June and will be published by pv magazine this summer.
Author: George Touloupas
This content is protected by copyright and may not be reused. If you want to cooperate with us and would like to reuse some of our content, please contact: editors@pv-magazine.com.