PhysRevLett.120.258301
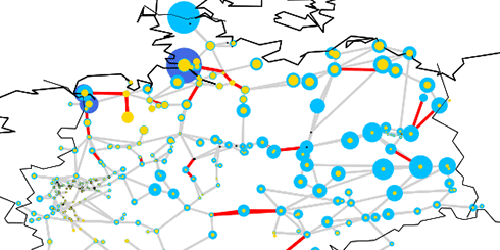
Top 5% most vulnerable lines in the German transmission network, depicted in red. Blue and yellow nodes represent wind and solar parks, respectively, and the size of a node is proportional to the amount of renewable generation produced at that location. The snapshot corresponds to January 1st 2011, 11 am.


By submitting this form you agree to pv magazine using your data for the purposes of publishing your comment.
Your personal data will only be disclosed or otherwise transmitted to third parties for the purposes of spam filtering or if this is necessary for technical maintenance of the website. Any other transfer to third parties will not take place unless this is justified on the basis of applicable data protection regulations or if pv magazine is legally obliged to do so.
You may revoke this consent at any time with effect for the future, in which case your personal data will be deleted immediately. Otherwise, your data will be deleted if pv magazine has processed your request or the purpose of data storage is fulfilled.
Further information on data privacy can be found in our Data Protection Policy.