From pv magazine 07/2020
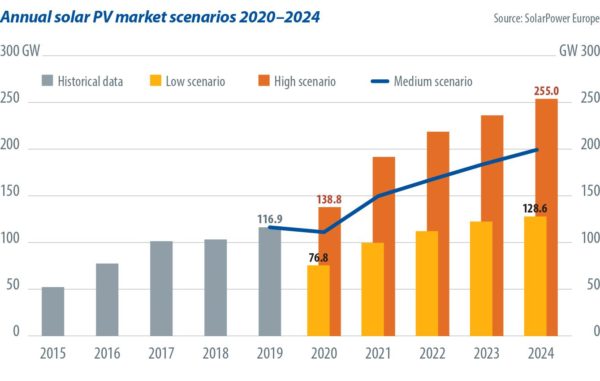
In 2019, the global solar market increased 13% from the year before, with 116.9 GW of installations, marking a new annual installation record. This record-breaking growth helped solar expand its annual share among all other power generation technologies to 48%, which means that solar accounted for almost half of the global net power capacity installed in 2019. Solar also broke cost records last year, proving that it is not only the most affordable renewable technology, but often the lowest-cost power generation technology overall. Only one year after several tenders saw solar-winning bids enter the $0.02/kWh level, a new frontier was reached in 2019, with solar tariffs in the $0.01-range achieved in four different regions: Latin America, North America, Europe, and the Middle East.
In SolarPower Europe’s new “Global Market Outlook”, which analyses solar installations in 2019, and forecasts capacity for 2020–24, solar’s record-breaking growth trajectory is highlighted across many dimensions. Alongside the headline number of terawatt scale by 2022, further milestones to expect in the next few years include solar reaching 700 GW by the end of 2020, and 1.2 TW by 2023.
Covid-19 impact
Covid-19 has had a huge impact on all markets around the world, and the solar sector also suffered from the effects of the pandemic. Due to the extended lockdown on the global economy, the solar market will experience a contraction in 2020, with an expected decrease of 4% to 112 GW in the medium scenario. Compared to last year’s “Global Market Outlook” forecast which projected 144 GW of new solar, this represents a decrease of 32 GW. This decline is due to reduced demand, and restrictions on labor and supply chain issues. However, if governments opt for sustainable post-Covid economic recovery packages, solar is forecast to undergo strong growth in the next four years.
SolarPower Europe market analysis found that the pandemic will not pose a significant risk in the medium term for utility-scale solar, while the C&I and residential sectors might see negative impacts for some time, as businesses and consumers will not necessarily invest in solar if they are struggling from a longer economic downturn. Here, any post-Covid economic stimulus package will play a very important role, indirectly to boost national economies to enable a healthy business environment, but also directly, offering financial incentives for solar investments, which some countries and regions have already announced.
Governments around the world, when putting together stimulus packages, already understand the value of solar to create jobs and lead the energy transition. In Malaysia, the government announced a new tender for 1 GW (AC) utility-scale solar capacity to be set up in Peninsular Malaysia as part of its Covid-19 recovery measures. The Swiss government has recently given the green light to support the expansion of solar PV systems this year with CHF 46 million ($48.5 million) as part of its green recovery. At the end of May, the European Commission proposed a two-year, €750 billion Covid-19 recovery instrument, “Next Generation EU.” The European Green Deal will be at the core of the EU’s recovery strategy, rolling out solar energy projects across member states and launching a massive renovation of the EU’s building stock and infrastructure, which will benefit solar as well.

Sub-Saharan Africa
Notable growth regions in 2019 included Europe, which added 22.9 GW – more than twice the capacity of 2018 – and the Middle East and Africa, where tenders helped several countries turn into viable on-grid solar markets. In the case of Sub-Saharan Africa (SSA), these tenders were frequently and successfully facilitated by developing finance institutions, which is why for the first-time SolarPower Europe focused on this region, with cooperation from GET.invest, to provide a detailed background for on-grid solar in SSA.
SSA has the lowest rate of access to electricity in the world; in 2018, only 48% of the population had electricity access. But the electrification rate is rapidly increasing – between 2010 and 2018, it grew by 14%, from 34% to 48%, and five out of 46 countries in SSA have reached electrification rates above 90% (Seychelles, Mauritius, Cabo Verde, Gabon, and South Africa). But these numbers show there is a long way to go to provide power to all people. Low-cost and scalable solar is a particularly appropriate solution to speed up that process.
In terms of annual market size in 2019, the SSA solar market more than doubled, adding nearly 1.3 GW of installations, thus reaching gigawatt scale for the first time ever. South Africa dominated 2019, accounting for roughly 40% of all installations in SSA. Aside from South Africa, the other three largest markets in 2019 were Namibia, Kenya, and Zambia, with around 100 MW each.
SolarPower Europe projections show that between 2020 and 2024, the SSA solar market will see a significant increase in installed capacity. According to the medium scenario, the region will add 21 GW of solar in this period. Once again, South Africa is expected to remain the largest market in the near future. However, recent political commitments to renewables and attractive regulatory frameworks are expected to catapult a number of smaller markets to become leaders with annual additions in the hundreds of MW – in countries such as Zambia, Ethiopia, Zimbabwe, and Nigeria.
Gigawatt scale
Installing a gigawatt of solar capacity in a year is a key milestone in the solar development of any country. In 2019, 16 countries installed more than 1 GW of solar, which represents a 45% growth rate compared to the 11 gigawatt-scale solar markets in 2018. Due to Covid-19, the forecast anticipates that only 14 countries will install 1 GW of solar capacity in 2020. However, it is expected that solar growth will accelerate next year, with 19 gigawatt-scale markets in 2021, and at least 21 in 2022. The top three solar installers for 2019 were China, the United States, and India. Special mention must also go to Vietnam, the fifth-largest installer in 2019, with 6.5 GW of additions – a gigantic 6,400% increase from the 97 MW added in 2018.

China, the world’s largest PV market by far, installed 30.1 GW in 2019, which was 32% less than its installations in 2018. By the end of 2019, China’s cumulative installed capacity reached 204.3 GW, representing 17.1% year-over-year growth. While newly installed capacity in China declined, its production value chain continues to undergo rapid growth. In 2019, polysilicon output in China was approximately 342,000 tons, equal to 32% year-over-year growth. The production of silicon wafers, cells, and modules reached 134.6 GW, 108.6 GW, and 98.6 GW, respectively, with respective growth rates of 25.7%, 27.7%, and 17.7%.
The United States, consistently a solar heavyweight, saw an almost 20% market uptick to 13.3 GW in 2019, up from 11.1 GW the year before. The main growth driver was the looming decrease of the federal solar investment tax credit (ITC), which dropped from 30% in 2019 to 26% in 2020, and was complemented by several state renewable portfolio standards. The bulk of new capacity came from utility-scale solar, which is traditionally the largest PV segment and was responsible for 63% of newly installed capacity. While rooftop solar grew by 15% to a new installation high of 2.8 GW, another very positive solar development took place in the corporate sourcing segment. From around 9.6 GW of solar PPAs signed in 2019, around 8.6 GW were inked in the United States, according to BloombergNEF.
India’s solar market, the world’s third largest, decreased in 2019, adding 8.8 GW, which is an 11% decrease from the 9.9 GW added in 2018. There are multiple reasons for the decrease of solar demand in India. Beyond issues with goods and services tax, safeguard duties, land problems, access to financing, and grid quality, a new state government in Andhra Pradesh recently began to renegotiate PPAs for multiple gigawatts with local solar producers. Due to liquidity constraints, there have been several instances in Uttar Pradesh and Karnataka, India’s largest state solar market in 2019, where state power distribution companies have attempted to renegotiate or cancel signed PPAs with solar and wind developers.
A solar market that was on nobody’s radar, Vietnam, added 6.5 GW in 2019. This solar boom is due to an attractive and uncapped feed-in tariff scheme, offering 20-year FIT contracts for $0.0935/kWh. Announced in April 2017 with a deadline for this incentive level set for end of June 2019, most of the systems were grid-connected in the first half of 2019. In addition, Vietnam created a net-metering scheme to support distributed generation, with buying and selling prices determined on an annual basis depending on the VND/USD exchange rate, which resulted in 270 MW of rooftop installations last year.
Green recovery
Depending on the priorities of Covid-19 economic recovery packages, the global solar sector can return to its impressive growth trajectory over the next five years. Today, solar delivers affordable and reliable energy to households and businesses across all continents, and it is imperative that we maintain this momentum. If policymakers in key markets choose to reap the benefits of solar and place it high on the agenda in their recovery packages, this would not only help economies bounce back, but would also ensure those countries progress in meeting their energy and climate targets. The low cost, scalability, and job intensity of solar makes it an obvious contender to lead the energy transition and help guide economies into a climate-neutral era.
 About the author
Michael Schmela is executive adviser, head of market intelligence, and a member of the leadership team at SolarPower Europe, the continent’s PV industry association. Schmela has been working in the solar industry for more than 20 years. After co-founding Photon-Magazine in 1996, he served in various positions in the Photon group, primarily as editor-in-chief of Photon International. In 2014, Schmela started MISCHCO, a company offering strategic consulting and communication services to solar companies.
The views and opinions expressed in this article are the author’s own, and do not necessarily reflect those held by pv magazine.
This content is protected by copyright and may not be reused. If you want to cooperate with us and would like to reuse some of our content, please contact: editors@pv-magazine.com.


By submitting this form you agree to pv magazine using your data for the purposes of publishing your comment.
Your personal data will only be disclosed or otherwise transmitted to third parties for the purposes of spam filtering or if this is necessary for technical maintenance of the website. Any other transfer to third parties will not take place unless this is justified on the basis of applicable data protection regulations or if pv magazine is legally obliged to do so.
You may revoke this consent at any time with effect for the future, in which case your personal data will be deleted immediately. Otherwise, your data will be deleted if pv magazine has processed your request or the purpose of data storage is fulfilled.
Further information on data privacy can be found in our Data Protection Policy.