
Late last week a plume of Saharan dust carried by Atlantic winds passed over Europe, dropping daily irradiance by up to 25%, as dust in the atmosphere scattered, absorbed and reflected sunlight. Prevalent westerly winds carried the dust from the Iberian peninsula on February 14, to Germany on February 16. Areas impacted during the middle of the day saw peak irradiance losses of up to 30%, and large areas of northern Europe, in particular the Netherlands and Germany saw 15-25% of daily irradiance lost on February 15 and 16.
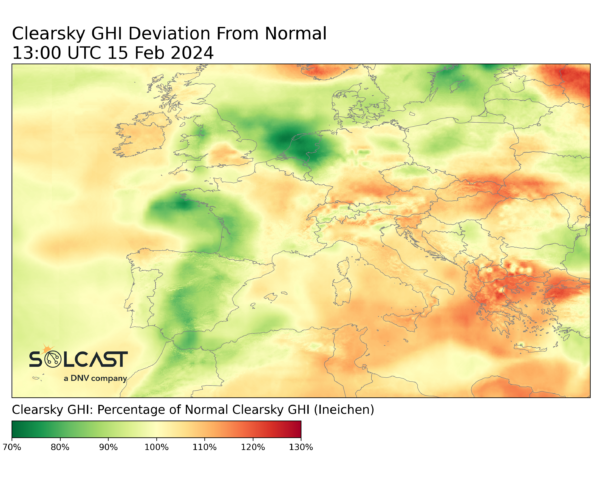
On February 14, a high pressure system over North Africa and low pressure in the Norwegian Sea directed westerly winds across the continent in the low to mid levels of the atmosphere, carrying Saharan dust from west to east across Europe. Dust in the atmosphere reduces irradiance by scattering sunlight as it passes through the atmosphere, appearing as haze to viewers on the ground, and decreasing the irradiance received at the surface. Dust also affects solar production by settling on and soiling panels, decreasing generation efficiency even after the dust has cleared from the atmosphere. Asset operators in affected areas may find decreased generation from these soiling effects.
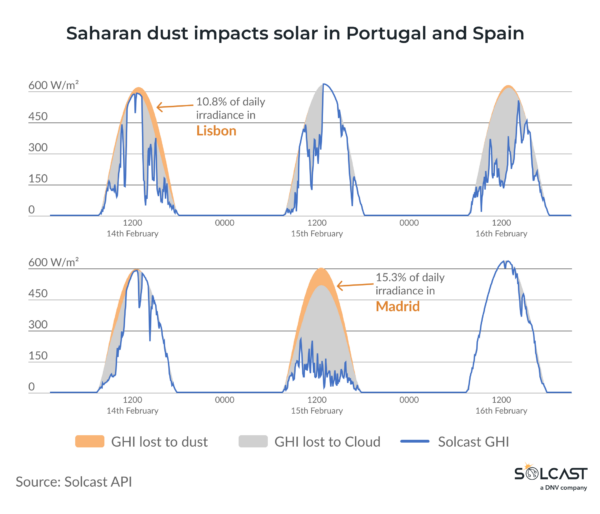
As the dust impacted Portugal mostly in the late afternoon and early evening Lisbon only lost 10.8% of daily production on the 14th. Contrast that to the 15% seen in Madrid, and higher in Northern Spain as the dust passed at midday on February 15. Madrid and much of Spain saw a cloudy day anyway, limiting their total generation regardless of the aerosol impact. Solcast's clearsky model also accounts for variations in other atmospheric conditions which explain the other differences seen from normal in other regions of Europe. For example, lower moisture over Spain on February 16 meant that there was above average clear sky irradiance, good news for asset operators following the cloud and dust losses the previous day.
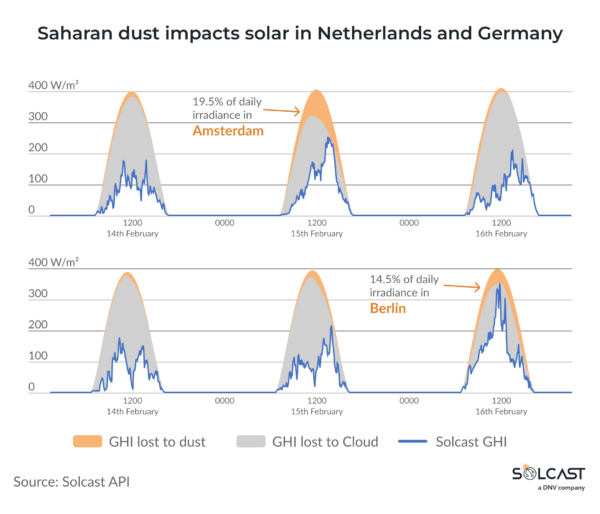
Further north, the effects were more pronounced, with parts of the Netherlands and Germany seeing up to 30% generation losses in the peak of the day, and total daily generation decreased by 15-25%. Interestingly the effects were localised enough that you can see the heavier dust losses in the afternoon in Amsterdam, something which on a cloudless day would materially impact the shape of the solar
generation curve.
This analysis is completed using irradiance parameters available in the Solcast API.
Solcast produces these figures by tracking clouds and aerosols at 1-2km resolution globally, using satellite data and proprietary AI/ML algorithms. This data is used to drive irradiance models, enabling Solcast to calculate irradiance at high resolution, with typical bias of less than 2%, and also cloud-tracking forecasts. This data is used by more than 300 companies managing over 150GW of solar assets globally.
The views and opinions expressed in this article are the author’s own, and do not necessarily reflect those held by pv magazine.
This content is protected by copyright and may not be reused. If you want to cooperate with us and would like to reuse some of our content, please contact: editors@pv-magazine.com.

1 comment
By submitting this form you agree to pv magazine using your data for the purposes of publishing your comment.
Your personal data will only be disclosed or otherwise transmitted to third parties for the purposes of spam filtering or if this is necessary for technical maintenance of the website. Any other transfer to third parties will not take place unless this is justified on the basis of applicable data protection regulations or if pv magazine is legally obliged to do so.
You may revoke this consent at any time with effect for the future, in which case your personal data will be deleted immediately. Otherwise, your data will be deleted if pv magazine has processed your request or the purpose of data storage is fulfilled.
Further information on data privacy can be found in our Data Protection Policy.