
Last year was a rough one for the U.S. solar industry. The Trump Administration’s Section 201 tariffs wreaked havoc on utility-scale solar project development, including during the period of uncertainty before tariff levels were set, leading to a mid-year slump.
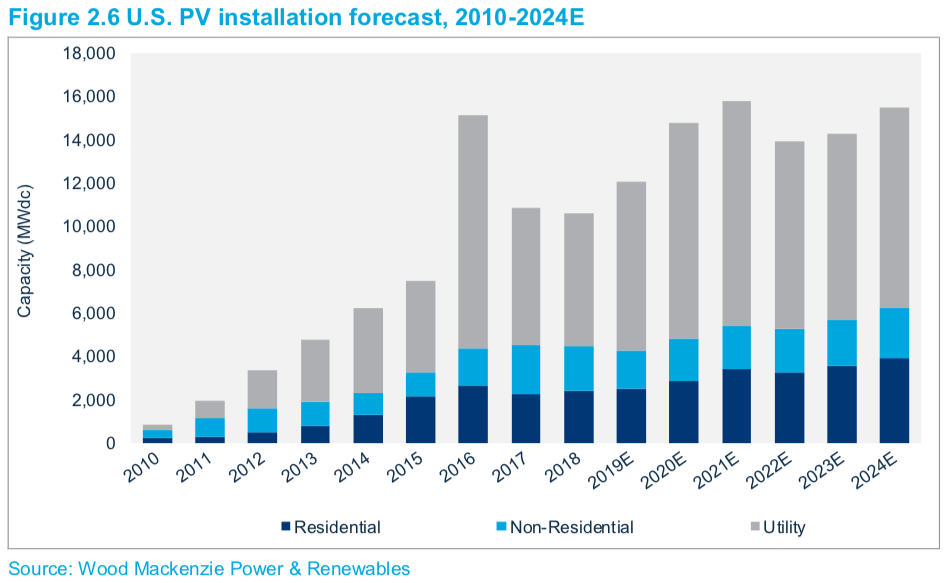
But solar is roaring back, as revealed in the figures in the latest U.S. Solar Market Insight report, a joint publication by analyst Wood Mackenzie Power & Renewables and industry body the Solar Energy Industries Association (SEIA). The report shows 4.2 GWdc of solar was installed in the final three months of last year, and 10.6 GWdc over the full year – only a 2% drop on 2017 levels.
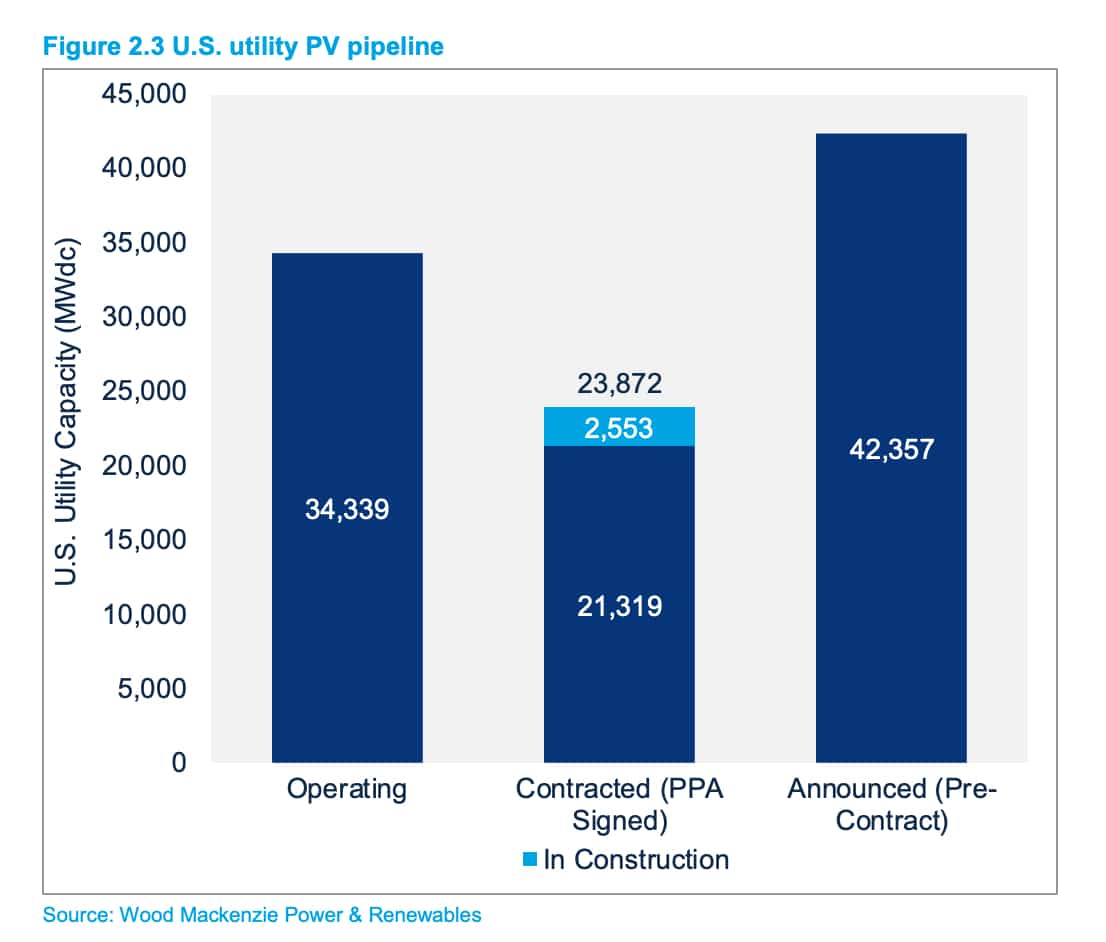
And the best is yet to come. The United States finished the year with nearly 24 GWdc of utility-scale projects under power contracts, a volume only ever exceeded three months ago. Furthermore, 2.6 GWdc of those contracted projects are already under construction.
Looking beyond projects which have secured contracts, Wood Mackenzie identified more than 42 GWdc of capacity that has been announced and which is in interconnection queues nationally.
That is much less than pv magazine found, however. Examining the interconnection queues of six grid operators at year’s end, we reported 139 GWac of solar projects. Add in the 25 GWac of projects in the Southwest Power Pool queue, and that brings in 164 GWac – and doesn’t even count the Mountain West or the South, which do not have wholesale power markets overseen by third-party grid operators.
It is likely Wood Mackenzie and the SEIA are only looking at a subset of projects, and it is not clear what their criteria were. In either case, not all of the projects pv magazine tallied will get built given the highly speculative nature of project development, but what is clear is that solar project development activity has reached levels never seen before.
Residential rebound
Both utility-scale solar and Wood Mackenzie’s “non-residential” category – which includes commercial, industrial, government, non-profit and other distributed solar – declined last year versus 2017 numbers. In some states the fall in non-residential was driven by policy changes, with the wait for the roll-out of the Solar Massachusetts Renewable Target program leading to a 64% year-on-year decline in Massachusetts, for instance.
But while those two categories fell, residential installations bounced back, growing 7% on 2017 levels. The 2.4 GWdc of installations during the year did not bring residential solar back to 2016 levels but did show resilience. Arizona, New Jersey and New York may have been sluggish but California installations came back to nearly 1 GW and Florida rose to be the fifth-largest residential market.
The recovery does not mean it will be plain sailing for residential solar installers, though, particularly as regards customer acquisition. “As major state markets continue to grow past early-adopter consumers, higher costs of customer acquisition will challenge the industry to innovate,” warned the report’s executive summary.
Gas dominates new capacity
For the first time since 2013, solar and wind did not make up most of the new capacity installed. Solar Market Insight estimates solar accounted for 29% of new U.S. electricity generation capacity additions, with wind adding 16%.
Instead, 2018 was a record year for natural gas build-out. FERC’s Energy Infrastructure Update estimated 20 GW of gas came online, and the U.S. Department of Energy’s Energy Information Agency put the number at 19.3 GWac of new capacity, versus 4.7 GWac of gas retirements.
Many of the new gas plants were on the east coast and in the Midwest and South, with gas largely replacing an estimated 12.9 GWac of retiring coal plants during the year.
The Lone Star rises
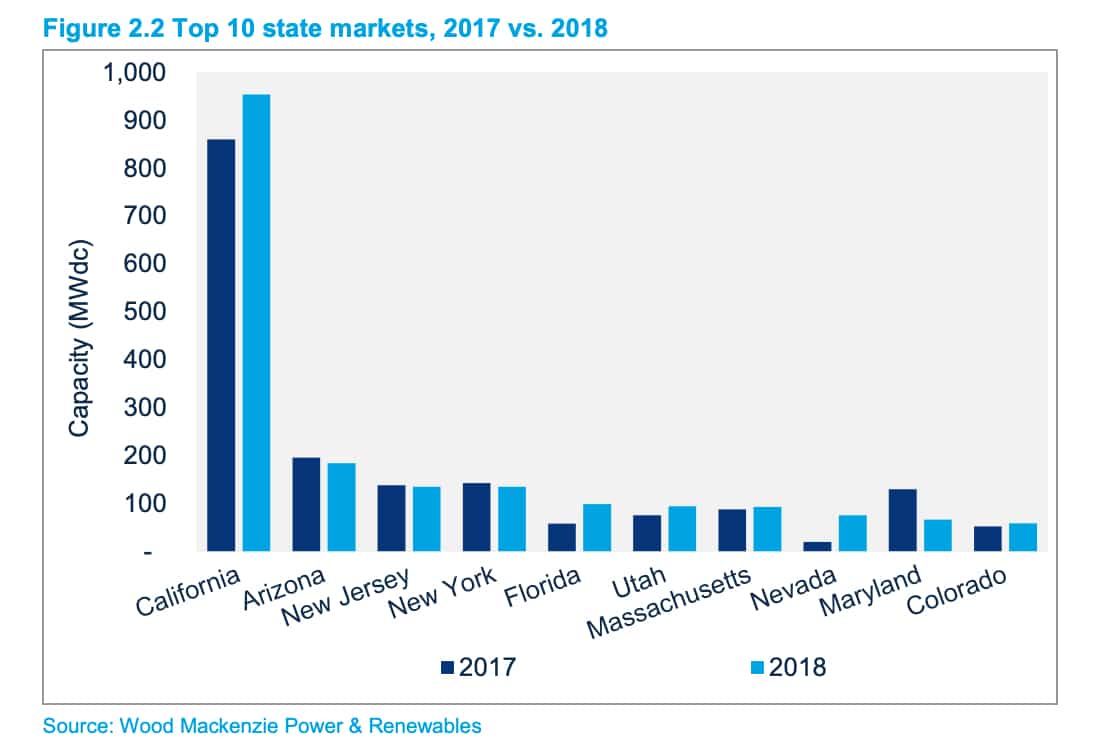
Finally, it’s time to look at one of our favorite features in every edition of the report: state installed capacity rankings. Outside California, this year’s big winner was Texas. The Lone Star State vaulted from having the fourth-largest market in 2017 to second-place last year, adding nearly 1 GWdc. Texas passed North Carolina, which fell one spot to #3, with Florida, Nevada, New York, New Jersey, Minnesota, Arizona and Massachusetts rounding out the top 10.
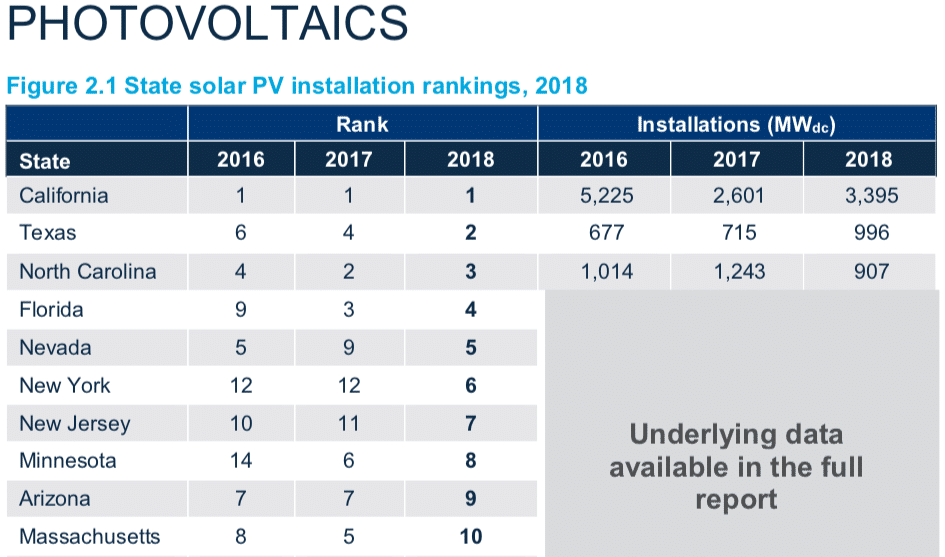
We’re expecting a lot more from Texas this year, as the state grid operator has already approved more than 5 GW of projects, nearly all of which are expected to come online in the next three years.
Wood Mackenzie is optimistic about that period on the national scale, and expects installations this year will come in at around 12 GWdc, and that the market will rise to nearly 16 GW in 2021, during the most favorable portions of the declining Investment Tax Credit.
Tim Sylvia co-wrote this report.
This content is protected by copyright and may not be reused. If you want to cooperate with us and would like to reuse some of our content, please contact: editors@pv-magazine.com.

2 comments
By submitting this form you agree to pv magazine using your data for the purposes of publishing your comment.
Your personal data will only be disclosed or otherwise transmitted to third parties for the purposes of spam filtering or if this is necessary for technical maintenance of the website. Any other transfer to third parties will not take place unless this is justified on the basis of applicable data protection regulations or if pv magazine is legally obliged to do so.
You may revoke this consent at any time with effect for the future, in which case your personal data will be deleted immediately. Otherwise, your data will be deleted if pv magazine has processed your request or the purpose of data storage is fulfilled.
Further information on data privacy can be found in our Data Protection Policy.