From pv magazine USA
As more states establish renewable energy mandates and expand the penetration of solar onto their grids, officials and developers are finding that locating land for these projects can be tricky. A new study released by the University of Texas at Austin’s Webber Energy Group looks to solve some of these siting issues by using publicly available and underutilized land at interstate exits.
The report looks at land surrounding interstate highways. It shows that most right-of-way (ROW) lands come in long, narrow stretches along interstate roads. These stretches are generally too narrow for solar PV, while meeting all existing safety and other regulations governing ROW use and development.
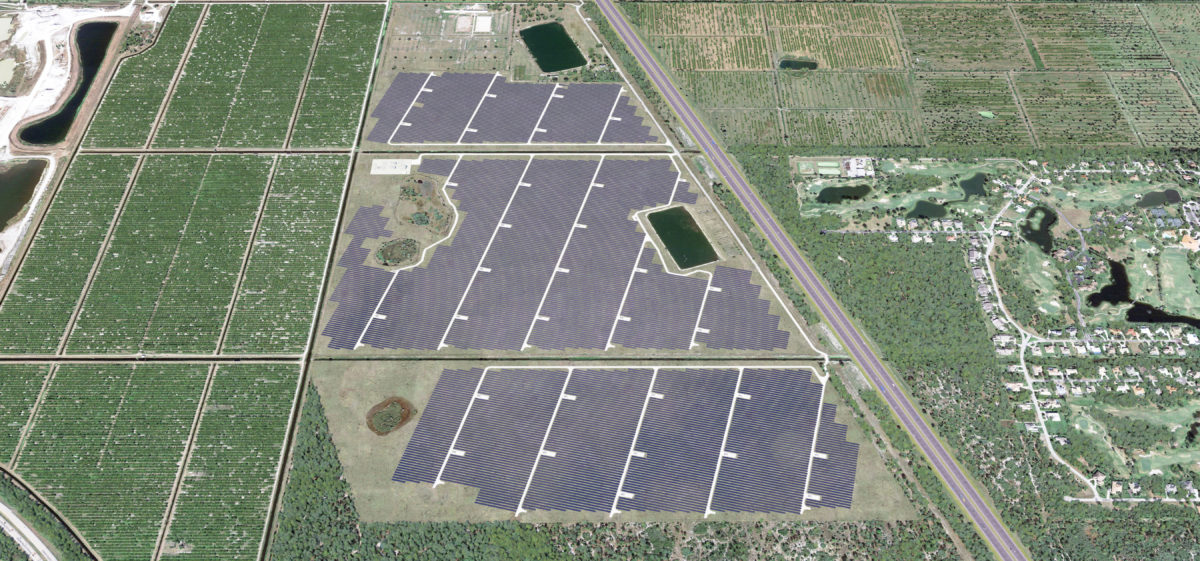
With this in mind, the authors of the report settled upon analyzing the solar potential of ROW lands at interstate exits and interchanges. Their methodology became a mapping tool, developed in partnership with The Ray, of a section of Interstate 85 in Georgia that is often a site for testing innovations in highway technology. This area includes a 1 MW solar array.
The authors had other existing ROW solar installations to supplement their research, including a 1.9 MW installation across two sites in Oregon, a 4.3 MW series of projects across eight sites in Massachusetts, and a 1.8 MW series of installations across five sites in Maryland.
Additionally, much of the methodology used in creating the mapping tool and projections was based on geographic information system (GIS) data showing the exact ROW boundaries along interstates in Iowa – the only state that the authors found to keep such detailed ROW data.
Road results
For the purpose of this report, the analysis was restricted to interstate interchange locations. The authors found that most states have more than 200 miles of suitable interstate frontage remaining, totaling between 440 and 6,600 acres of ROW area in interchanges available for solar installation.
While that variance in area is big, the even greater variance comes in the estimations of retail electricity prices and solar capacity factors, as well as total area available by state. The authors did find that most states have solar potential in the thousands of GWh per year, with numbers ranging anywhere from 127 to 1,814 GWh annually, as well as several hundreds of millions of dollars of prospective revenue to the state.

Broken down by state, Texas has the most potential solar energy per year if every identified interchange in each state were developed with solar, with well over 1,750 GWh/year. Illinois and California follow in second and third, respectively. After the top three there is a considerable drop-off, with Florida coming in fourth and Virginia rounding out the top five.
The measurements for annual solar generation potential exclude Delaware and Rhode Island, for lack of available interchanges to develop.

This methodology isn’t perfect, nor does it tell the full story. The report notes that rest areas could significantly supplement potential ROW solar capacity, but there is not currently enough available data regarding solar installations at rest areas to develop an effective methodology to track potential capacity. The report was also developed with fairly limited ROW information, as Iowa is the only state to have publicly available GIS data on ROW boundaries.
This content is protected by copyright and may not be reused. If you want to cooperate with us and would like to reuse some of our content, please contact: editors@pv-magazine.com.


Reactors take up waaaaay less space, last twice as long, have no intermittency issues, and do not rely on favorable weather.
“limited to interchanges” ? Why? Driving rural Mn highways you can see huge land availability and electrical transmission lines. Couple that with projected EV adoption and states always looking for revenue, you can see pv powered charging stations (and park-and-rides) being privately developed but paying a percentage lease fee for the DOT owned land. Seems like a win-win so long as government doesn’t screw things up by thinking they should be the developer/mis-manager.