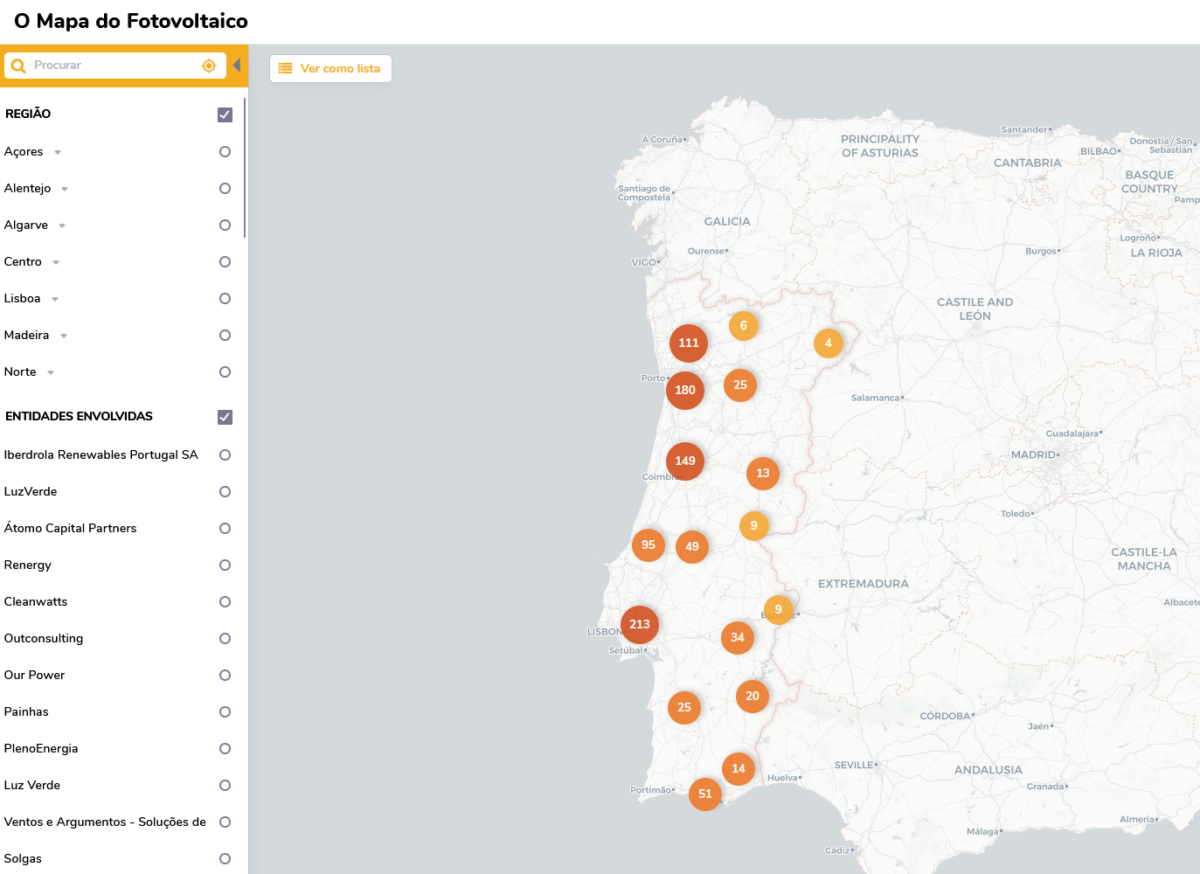
Observatório Fotovoltaico, a Portuguese service platform for the solar industry, has developed a free, web-based, interactive map of PV projects in Portugal.
Rodrigo Silva, the project leader, told pv magazine that he recognized that so far the public had access to two kinds of information: official statistics from the Directorate General for Energy and Geology (DGEG) or the national association for renewable energy (APREN), offering limited data on installed capacity, or scattered details from companies promoting their work through various online platforms like websites and LinkedIn pages.
Silva launched the “PV Map” in March 2023. He already manually mapped more than 1,000 PV projects across the country, corresponding to roughly 60% of Portugal’s total installed capacity, and is now looking for companies to volunteer information on projects not yet mapped.
The map can currently be filtered by region, project developer, and exploration type, including self-consumption, energy communities, large-scale, feed-in-tariff, mini-generation, microgeneration, PPA, and off-grid. When selecting a particular project, it also shows information about its installation size, year of commissioning, and media links.
A lot of the identified projects still have missing data, but Silva hopes the process will be sped up as more companies volunteer their information. A partnership with DGEG or APREN would be a welcome development for the project, which aims to facilitate access to quality information about solar in Portugal.
The platform launched a new feature this week and has other announcements in the pipeline.
“I noticed that as the number of projects increased, it became more difficult to have an overview of their applications,” said Silva. “So, I found a way to classify the entity that benefits from solar production according to their sector of activity. This gives companies insight into the sectors where they have the most or fewer customers, as well as political entities insight into how the adoption of this technology evolves in the various sectors.”
The provisional results, currently published as infographics on LinkedIn and as exclusive reports to partnering companies, show that the food industry benefits the most from solar production, followed by the mineral industry, education, and the textile industry.
This content is protected by copyright and may not be reused. If you want to cooperate with us and would like to reuse some of our content, please contact: editors@pv-magazine.com.

3 comments
By submitting this form you agree to pv magazine using your data for the purposes of publishing your comment.
Your personal data will only be disclosed or otherwise transmitted to third parties for the purposes of spam filtering or if this is necessary for technical maintenance of the website. Any other transfer to third parties will not take place unless this is justified on the basis of applicable data protection regulations or if pv magazine is legally obliged to do so.
You may revoke this consent at any time with effect for the future, in which case your personal data will be deleted immediately. Otherwise, your data will be deleted if pv magazine has processed your request or the purpose of data storage is fulfilled.
Further information on data privacy can be found in our Data Protection Policy.