Behind-the-meter solar production plummeted across the UK, Netherlands and Germany from Oct. 19-20 last week due to the impact of Storm Babet.
Clouds from large storms like Babet can reduce irradiance locations to less than 10% of clear sky conditions. This decreases generation from solar assets and can cause large net grid demand. This is because residential inverters increasingly raw power from the grid instead of rooftop assets.
The Solcast analysis includes data from grid-scale assets, behind-the-meter generation estimates and Solcast’s Grid Aggregation model data. It also utilizes algorithms trained on global irradiance data and grid data to estimate the aggregate behind-the-meter capacity in grid load zones.
The scale of the impact across these countries underscores the critical need for proactive management by grid operators. As residential solar markets mature, the grid impact of rooftop solar becomes more significant. Large weather events like Storm Babet need to be proactively managed by grid operators to ensure stability.
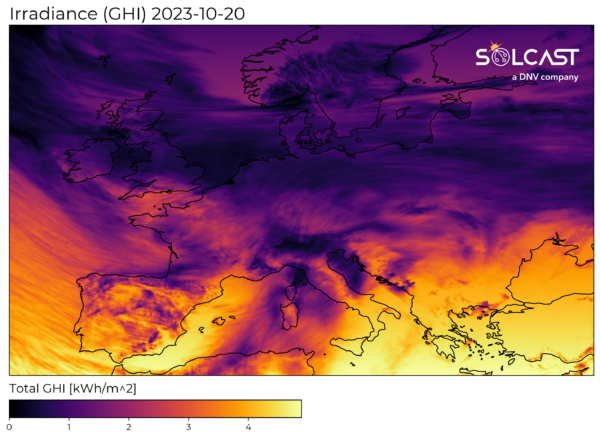
After a relatively sunny start to the week, Storm Babet covered the hemisphere in clouds and rippled behind-the-meter generation for Thursday and Friday. As can be seen from the above GHI image, large areas received almost no irradiance, at or below 1kWh/m^2 for the day, from Northern Ireland to Lithuania.
In the UK for Tuesday, total solar, including behind-the-meter generation, was 34 GWh. It dropped to 10-15 GWh from Wednesday to Friday. Germany has more residential solar capacity and dropped from 112 GWh to below 30 GWh during the storm. The 50hertz TSO region in eastern Germany saw the largest relative drop, with Friday receiving just 4.5 GWh – 11% of Wednesday’s 40.2 GWh.
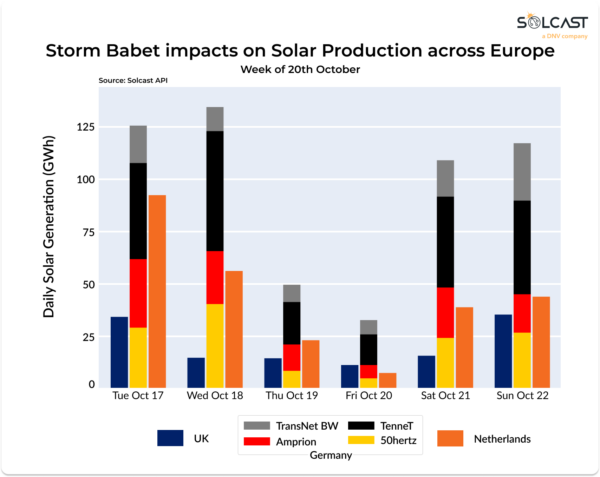
In the Netherlands, due to the smaller land area and more concentrated effects of the storm, the drop was particularly sharp. Friday recorded 7.1GWh, which is 92% down from 92.1GWh earlier in the week.
Forecasts based on aggregated models, such as the one used here, are used by grid operators to plan requirements for responsive power dispatch. This is typically through storage, hydro, or most commonly fossil or biomass gas generation.
Solcast produces these figures by tracking clouds and aerosols at 1-2km resolution globally, using satellite data and proprietary AI/ML algorithms. This data is used to drive irradiance models, enabling Solcast to calculate irradiance at high resolution, with a typical bias of less than 2%, and also cloud-tracking forecasts. This data is used by more than 300 companies managing over 150GW of solar assets globally.
The views and opinions expressed in this article are the author’s own, and do not necessarily reflect those held by pv magazine.
This content is protected by copyright and may not be reused. If you want to cooperate with us and would like to reuse some of our content, please contact: editors@pv-magazine.com.

2 comments
By submitting this form you agree to pv magazine using your data for the purposes of publishing your comment.
Your personal data will only be disclosed or otherwise transmitted to third parties for the purposes of spam filtering or if this is necessary for technical maintenance of the website. Any other transfer to third parties will not take place unless this is justified on the basis of applicable data protection regulations or if pv magazine is legally obliged to do so.
You may revoke this consent at any time with effect for the future, in which case your personal data will be deleted immediately. Otherwise, your data will be deleted if pv magazine has processed your request or the purpose of data storage is fulfilled.
Further information on data privacy can be found in our Data Protection Policy.