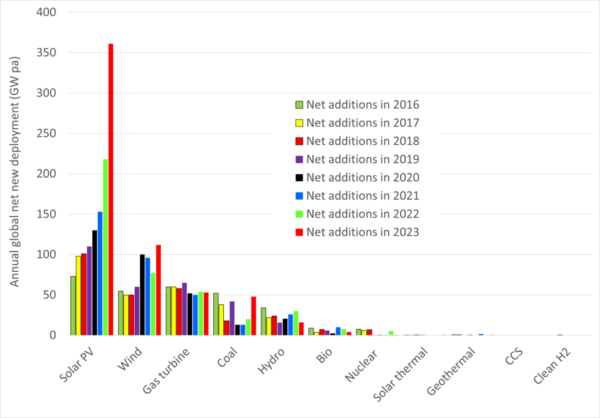
The fastest energy change in history is still underway. In 2023, solar photovoltaics and wind comprised about 80% of global net generation capacity additions. Four times as much new solar and wind electricity generation capacity was installed in 2023 as compared with everything else combined (gas, coal, hydro, nuclear and others). This constitutes compelling market-based evidence that solar and wind are the best options for new generation capacity.

Image: IRENA, IEA, GEM, WNA, GWEC
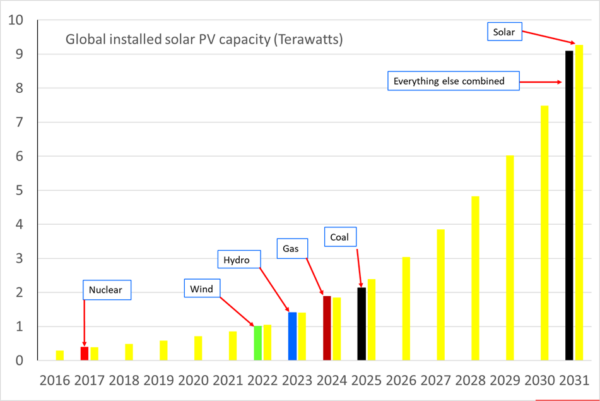
Cumulative global solar installed capacity passed 1.4 TW, and cumulative production reached 1.7 TW, which is more than tenfold larger than ten years ago, and it is doubling every 3 years. New solar capacity is being installed faster than anything else in history.
Total installed solar capacity surpassed total nuclear installed capacity in 2017; it surpassed wind in 2022, and hydropower last year, and should surpass fossil gas in 2024. At current growth rates of 20% per annum, solar will pass coal in 2025 to become the largest component of global generation capacity. Current growth rates also suggest that solar will reach 9 TW in 2031, and there will be more solar generation capacity than everything else combined.
The rapid and sustained growth of solar and wind generation capacity points to their future dominance of energy generation because the ever-increasing growth in global electricity demand growth is effectively being met by solar and wind, not fossil or nuclear energy. This growth in electricity demand is caused by rising affluence, rising population, and “electrification of everything.”
“Electrification of everything” eventually allows solar and wind to displace fossil fuel from most functions via electric vehicles, electric heat pumps, electric furnaces, and electrolysis of water to produce hydrogen for chemicals (reduction of metal oxides, ammonia, fertilizers, plastics, synthetic jet and shipping fuels).

Image: IRENA, IEA, GEM, WNA, GWEC
Construction supply chains and activities for other generation technologies are now far smaller than for solar and wind – compared with solar they are cottage industries. Magical growth rates from small construction bases are required for other low-emission technologies (such as nuclear or carbon capture & storage) to catch up with solar before mid-century.
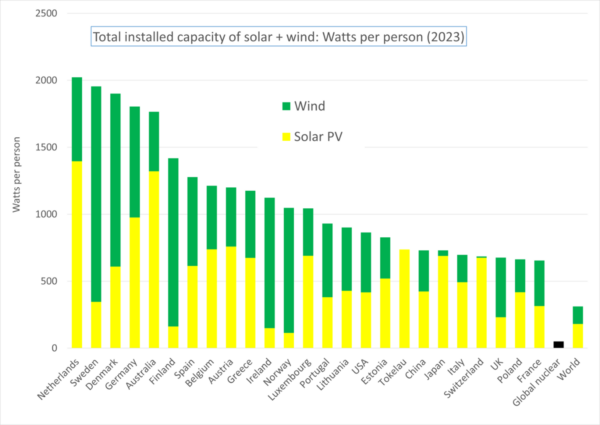
European countries and Australia lead in terms of watts per person of solar & wind. Unlike European countries, Australia is physically isolated and must go it alone. It turned out to be quite straightforward. Australia is currently at 40% renewables (mostly solar and wind) and will be at 82% in 2030. Prices and electricity emissions are falling, and the grid is very stable.
Also included in the graphics above is the global nuclear capacity per person – which has been static for the past dozen years. Nuclear has failed in the global energy marketplace.

Image: IRENA, WNA
Authors: Prof. Andrew Blakers /ANU) & Prof. Ricardo Rüther (UFSC).
Andrew.blakers@anu.edu.au and rruther@gmail.com
ISES, the International Solar Energy Society is a UN-accredited membership NGO founded in 1954 working towards a world with 100% renewable energy for all, used efficiently and wisely.
Popular content

The views and opinions expressed in this article are the author’s own, and do not necessarily reflect those held by pv magazine.
This content is protected by copyright and may not be reused. If you want to cooperate with us and would like to reuse some of our content, please contact: editors@pv-magazine.com.


This brings business opportunities in South Africa, I would like to be part of the winning team.