From pv magazine 04/2020
The CEA Supplier Benchmarking Program (SBP) aggregates gigawatts of quality assessment data to deliver a tool to judge PV module suppliers’ ability to deliver on promises of product quality, which will impact module reliability. Of the more than 55 GW of PV projects that CEA has been involved in, more than 16 GW include an onsite factory assessment, which makes up the SBP’s DNA.
The table below highlights the quality assurance activities which produce data for CEA’s benchmarking metrics. The scoring approach, outlined in the table to the upper right, is partially informed by the “failure mode, effects, and criticality analysis” (FMECA) methodology which allows every project to be assessed regarding the risk potential involved and then aggregated over time to provide a picture of supplier and factory performance.
Although the absolute values of the scoring system are arbitrary, they are assigned according to objective rules and guidelines. The goal is to be able to group suppliers and locations by grades ranging from “A+,” high-quality locations and suppliers, to “D,” low-quality and high-risk locations and suppliers. A risk score of 0 indicates flawless production, and lower scores are preferable.
| CEA’s quality assurance activities which encompass the SBP | |
| Factory audits | A team of CEA engineers audits a factory location using a 1,000+ point checklist. Processes and system are audited and every finding is recorded and classified according to risk potential. |
| Inline process monitoring | A team of CEA engineers continuously monitors all stations of a factory location during production of an order using a 260+ point checklist to assess inline quality control. For the SBP, total sum score is normalized over the duration of the project, so that different projects can be compared. |
| Pre-shipment inspection | CEA engineers perform visual, EL, and IV inspections to a randomly sampled lot of finished modules according to a list of vetted quality criteria. A risk priority number scoring method is applied on the defects found and characterized using CEA’s internal list of more than 50 defect types to determine a risk score. |
Each of the five grades are assigned to risk score values based on a percentile system that differs between service types. Grading ranges are produced by charting all scores for each service type, reviewing the results, and fine-tuning the ranges to accurately reflect CEA’s assessment of the comparative quality level of all factories. Location grades are derived by averaging projects completed at the same location, and supplier grades are determined by averaging location grades. The use of this quality data over time not only allows for the grading of suppliers and manufacturing locations, but also reveals changes in the PV manufacturing industry itself.
Tariff impact
In mid-2019, the U.S. Trade Representative made a surprise revision to its Section 201 Tariff exclusion list which exempted bifacial products. The announcement created unexpected demand for non-China bifacial production, which many suppliers had not anticipated. Non-China suppliers and original equipment manufacturers (OEMs) in Asia quickly began ramping up bifacial lines and taking on additional orders.
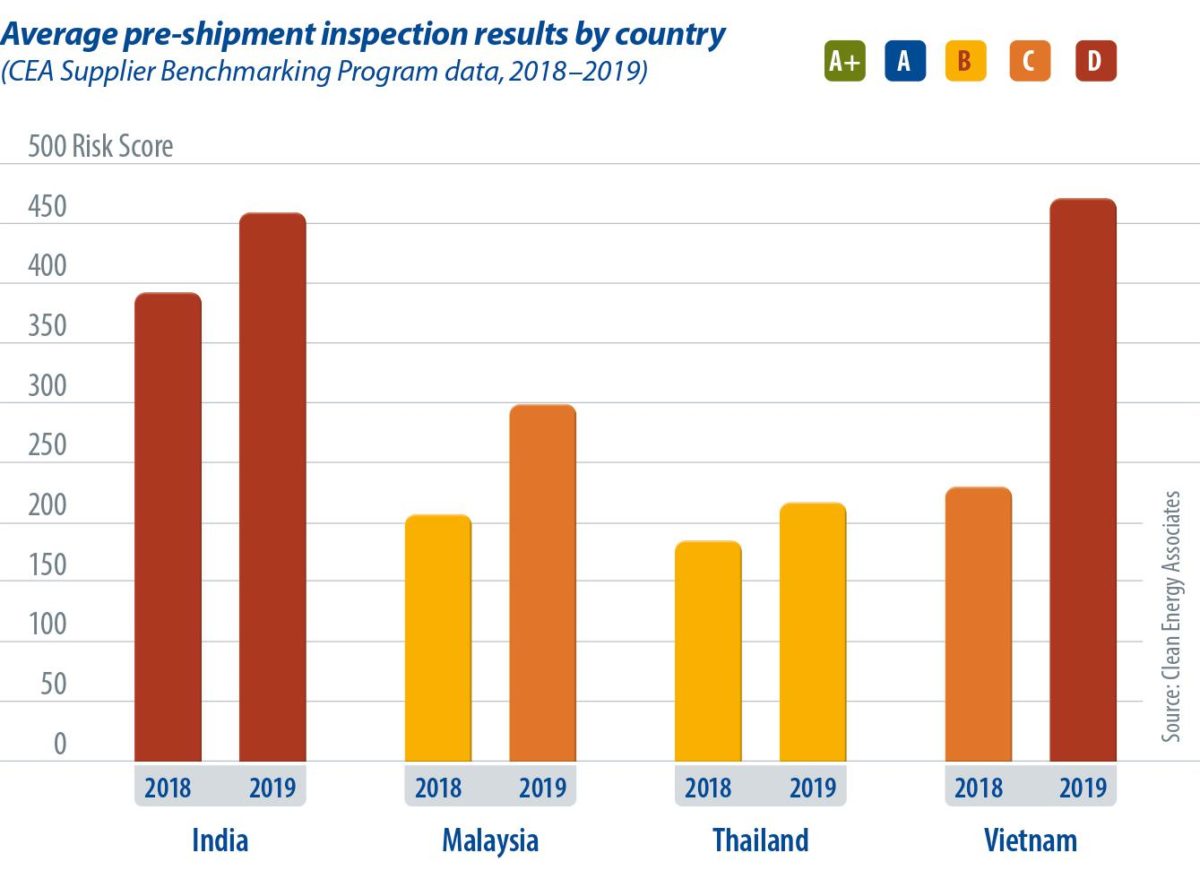
Some facilities took too many orders, operated above maximum capacity, and cut corners to meet production schedules. These facilities also worked to incorporate the new production techniques and materials needed for bifacial with the minimum testing time needed to get new lines running. The graph below left details the change in average PSI score by non-China location between 2018 and 2019 to show the rise in quality-related issues that can be attributed in part to the Section 201 Tariff ruling.
It is important to note that China also had an increasing PSI average risk score between 2018 and 2019. Based on CEA’s experience this is due to the combination of rapid expansions and new product rollouts, rather than overproduction. As suppliers continue to experiment with new products and methods, new manufacturing process issues continue to surface.
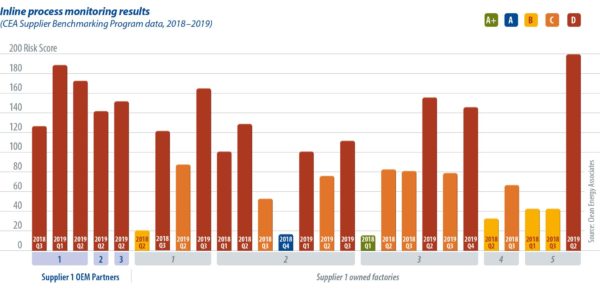
When looking at average inline process monitoring results, there is a similar trend of non-China facilities demonstrating higher risk scores. This is increased by the tendency of suppliers to rely on OEMs for non-China production, rather than taking financial risks by building additional capacity in a fluid trade war landscape. The graph below outlines one supplier CEA tracks in its SBP. Projects at OEM partner locations, both in China (location 3) and non-China (locations 1 and 2), consistently scored higher than the supplier’s own China-based facilities, indicating that more frequent and/or severe inline production findings take place when suppliers have less oversight. This is consistent when comparing average OEM and non-OEM risk scores across all of CEA’s quality assurance services.
With solar tariffs unlikely to abate following the Section 201 Midterm Review, quality for non-China facilities is unlikely to improve in the short term, while trade barriers are reducing available supply sources. Many China-based suppliers are also waiting for policy stability before committing to new non-China capacity, creating a difficult position for U.S. buyers looking to avoid price premiums and low-quality products.
| Grade | Description | FA score range | IPM score range | PSI score range |
| A+ | Exceptional location or supplier with very low quality risk | 0-16 | 0-11 | 0-92 |
| A | Good location or supplier with low quality risk | 17-27 | 12-29 | 93-122 |
| B | Above average location or supplier, with average quality risk | 28-57 | 30-114 | 123-227 |
| C | Average location or supplier with increased quality risk | 58-120 | 115-164 | 228-360 |
| D | Below average location or supplier with a very high quality risk | Over 120 | Over 164 | Over 360 |
About the author
Joseph Johnson is a lead analyst for solar and storage at Clean Energy Associates, a firm that focuses on solar PV quality assurance, supply chain management, and engineering services. At CEA, he explores market trends, supplier quality, and trade policy as part of CEA’s Technology and Quality Department.
The views and opinions expressed in this article are the author’s own, and do not necessarily reflect those held by pv magazine.
This content is protected by copyright and may not be reused. If you want to cooperate with us and would like to reuse some of our content, please contact: editors@pv-magazine.com.

By submitting this form you agree to pv magazine using your data for the purposes of publishing your comment.
Your personal data will only be disclosed or otherwise transmitted to third parties for the purposes of spam filtering or if this is necessary for technical maintenance of the website. Any other transfer to third parties will not take place unless this is justified on the basis of applicable data protection regulations or if pv magazine is legally obliged to do so.
You may revoke this consent at any time with effect for the future, in which case your personal data will be deleted immediately. Otherwise, your data will be deleted if pv magazine has processed your request or the purpose of data storage is fulfilled.
Further information on data privacy can be found in our Data Protection Policy.