The International Energy Agency has today released its much anticipated World Energy Outlook to 2040. While it takes pains to assert the fact that it does not forecast the future, but rather provides a way of exploring different possible futures, there is no escaping the fact that policy makers around the world will be looking to this report to help shape their energy agendas.
Which is rather terrifying, considering the IEA not only envisages a future where coal, oil and gas continue to play leading roles in all of its scenarios, but because it also, at the same time, finds that carbon dioxide emissions are on the rise (by 1.6% in 2017), “after three flat years”, and that they are likely to continue rising “on a slow upward trend to 2040” – a trajectory “far out of step with what scientific knowledge says will be required to tackle climate change.”
Holding up a mirror
Overall, the IEA has identified four energy scenarios to 2040: the Current Policy Scenario (CPS), which reflects no change in today’s policies; the New Policy Scenario (NPS), which encompasses announced policies and targets; the Sustainable Development Scenario (SDS), which aims to meet climate goals, and provide universal energy access and clean air; and the Future is Electric Scenario (FiES), which imagines the increasingly important role of the electricity sector.
“None of these potential pathways is preordained; all are possible. The actions taken by governments will be decisive in determining which path we follow,” writes IEA executive director, Fatih Birol.
The agency has also introduced a new metric – said to confirm the “advantageous position” of wind and solar – termed the value-adjusted levelized cost of electricity (VALCOE), which combines the projected levelized costs of electricity (LCOE) with simulated energy value, flexibility value and capacity value by technology, and which is designed to help with cross technology comparisons. The IEA points out, however, that it fails to include the costs and benefits related to each technology. As such, it “could be improved by including additional relevant elements, such as network integration costs.”
The agency's main scenario – the New Policy Scenario – “holds up a mirror to the ambitions of policy makers around the world, as they exist today.” However, Birol cautions that we should not underestimate the “need and the potential to improve on these outcomes and to deliver a more secure, affordable, and sustainable energy future. The key message from this WEO is that decisions made by governments will play a critical role in this respect,” he says.
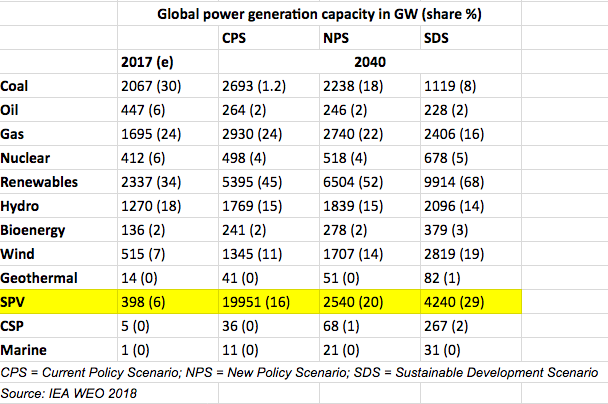
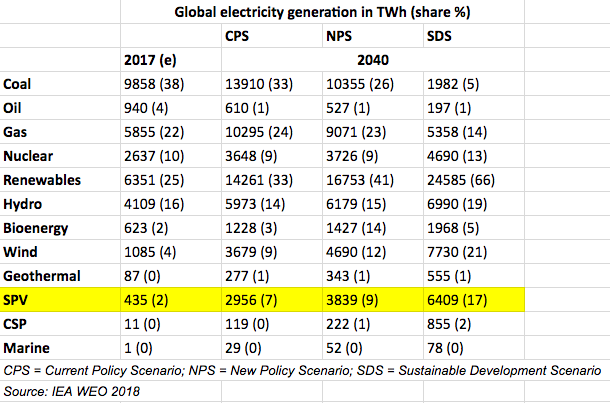
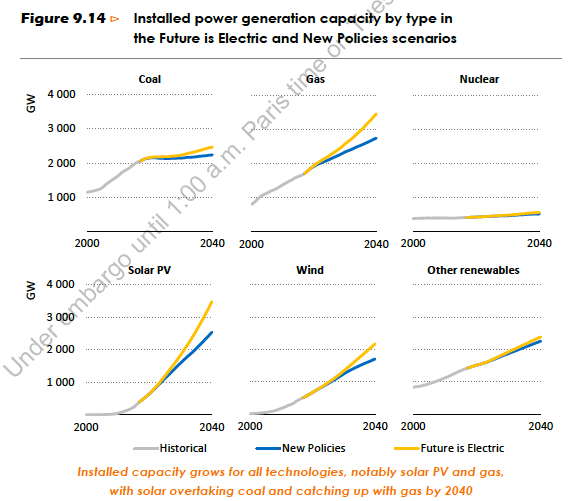
On a relatively positive note, the IEA finds that in every scenario, solar PV capacity will overtake that of all other energies apart from gas, by 2040. Specifically, in its NPS, it sees it overtaking wind before 2025, hydro by 2030, coal before 2040; while in its most flamboyant forecast – FiES – PV will catch up with gas by 2040.
While this is good news, one should not forget that the IEA has been guilty of consistently low-balling solar, and renewables, growth. In January, Auke Hoekstra, Senior Advisor in Electric Mobility at the Eindhoven University of Technology, took the IEA to task for getting solar projections wrong year after year.

Shifting demand
In its SDS, global energy demand will remain at today’s level, with electrification of end-uses growing strongly, and the direct use of renewables to provide heat and mobility. However, in the NPS, demand is projected to grow by over a quarter on the back of rising incomes and an extra 1.7 billion people on the planet.
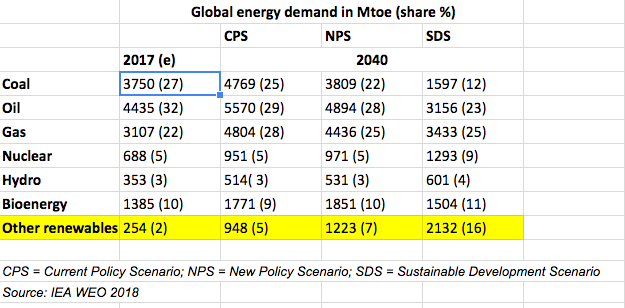
Having moved away from Europe and North America – in 2000 the regions were said to account for over 40% of global energy demand together – demand in Asia is now on track to take that figure on by 2040. In addition to ever cheaper renewables, digitalization and the rising role of electricity are driving change.
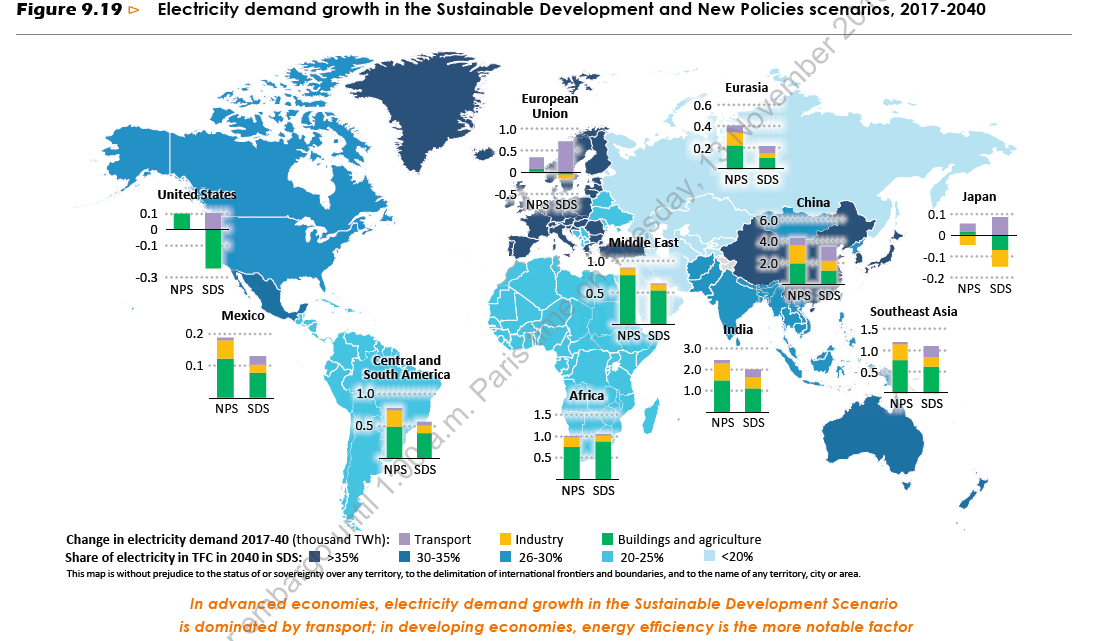
In particular, a “dramatic” transformation is said to be occurring in electricity, thus prompting the IEA to include a special report on the sector, and introduce the new FiES forecast. See Figure 9.19 (main image) for a map of the projected electricity demand growth in both the NP and SD scenarios.
The agency explains that electricity is increasingly becoming the “fuel of choice” in economies that are relying more on lighter industrial sectors, services and digital technologies. Its share in global final consumption is approaching 20% and is set to rise further. With this growth, issues like cyber security and system flexibility are becoming increasingly pertinent.
“Policy support and technology cost reductions are leading to rapid growth in variable renewable sources of generation, putting the power sector in the vanguard of emissions reduction efforts but requiring the entire system to operate differently in order to ensure reliable supply,” write the report's authors.
In a small piece of positive news, the IEA finds that, for the first time, the number of people without access to electricity fell below 1 billion in 2017. Despite this, the gap between progress and climate goals is still huge. And in its NPS, over 700 million people are still set to be without access to electricity by 2040, predominantly in sub-Saharan Africa, while “slow” progress is envisaged in moving away from solid biomass as a cooking fuel.
More in depth findings from this special electricity report will be covered in a separate article by pv magazine editor Marian Willuhn later today.
LCOE: Limited but still useful
Despite limitations, which led the IEA to develop its new VALCOE metric, it says LCOE is still an important tool, as it is straightforward to calculate and can provide a high level comparison.
Overall, the agency says the global average LCOE of PV and onshore wind has declined “substantially”, by 65% and 15%, respectively, over the past five years.
Due to differing factors, like labor costs, land availability and permitting processes, LCOE varies greatly from region to region. The IEA finds that China and India are the two lowest cost regions, “combining best-in-class average capital costs with good resources, while the European Union has a higher average levelised cost because of its relatively poor solar resources.”
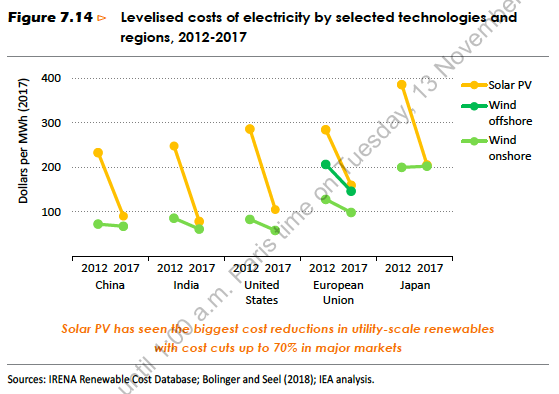
It adds, “The United States and Japan both have notably higher average capital costs for new projects, but these are moderated in the United States by high quality resources.”
While not directly comparable to LCOE – because best-in class projects with low financing costs are said to be able to achieve up to 60% lower costs than the global average LCOE – record prices have been secured for solar at recent auctions, including $24/MWh in the United Arab Emirates, $27/MWh in India, $20/MWh in Mexico and $18/MWh in Saudi Arabia.
Popular content
Declining upfront investment costs and improved performance, including increased module efficiencies and the adoption of trackers, are cited as the main drivers of decreasing PV costs.
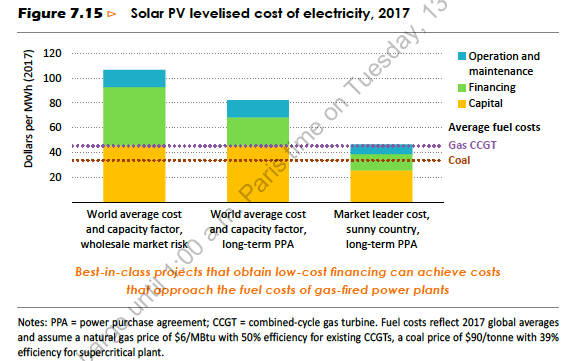
Specifically, IEA finds that global average capital costs have fallen by almost 70% since 2010 to $1,300/kW for average utility-scale projects in 2017, while average costs of smaller scale solar PV, like rooftop projects have declined by 40-80% since 2010, although they are said to remain 20-60% more expensive than utility-scale projects in most regions.
“The lowest upfront capital costs were in Germany ($1 090/kW), India ($1 125/kW) and China ($1 130/kW),” write the report's authors.
Overall, the IEA finds that PV is turning into one of the lowest cost options to produce electricity – in some countries even undercutting the investments required for new thermal generation and, in particular, coal-fired power. And while pairing it with storage raises the LCOE, its value is nonetheless increased as it helps ease integration into existing power systems.
Storage matters
Talking of storage, no energy outlook would be worth the paper it is written on, if it did not include an overview of the storage market. Again, while colleagues will provide more in depth information on this subject, a basic overview is presented below.
With the growing importance of the electricity sector, and renewables’ share marching ever upward, storage is also playing an increasingly important role in the energy mix. Its value and role, however, depend greatly on where it is deployed, its size and market conditions.
At 153 GW, pumped storage hydropower accounts for 2% of global power generation capacity and comprises the majority of the capacity to store electricity. However, the market for more decentralized battery storage technologies is growing fast. The current installed capacity of these other technologies combined totals around 4 GW.
Installed capacity is said to have tripled in under three years, primarily due to the uptake of lithium-ion batteries, which account for for just over 80% of all battery capacity, says the IEA. It adds, “Small-scale battery storage in particular is making inroads, and 45% of all annual capacity additions are now behind-the-meter. In off-grid solar applications for energy access, the vast majority of systems now include a storage unit.”
In its NPS, the agency forecasts that countries in Europe, Mexico, India and China are set to require a “degree of flexibility that has never been seen before at such large scale.” Under this scenario, battery costs decline rapidly and can increasingly compete with gas-fired peaking plants.
Despite this, conventional power plants are expected to remain the main source of system flexibility, says the IEA, supported by new interconnections, storage and demand-side response.
Investment
In terms of investment, the IEA finds that over 70% of the $42 trillion in energy supply investment in its NPS “is either conducted by statedirected entities or responds to a full or partial revenue guarantee put in place by governments.” Meanwhile, just over a quarter is expected to come from private enterprises.
Looking at the figures, the agency says that 2017 saw global energy investment declining slightly to $1.8 trillion, for the third year in a row. Of this figure, the lion’s share went to the electricity sector, it says, thus further highlighting the growing importance of this sector.
Overall, China leads the way, with estimates suggesting it comprises over one-fifth of the total amount globally.
Digging down into its different scenarios, the IEA says energy investment will amount to an average of $2.2 trillion each year between 2018 and 2025 and $2.8 trillion each year thereafter in its NPS, with fossil fuels benefitting the most in terms of total supply investments.
“Average annual upstream oil and gas spending rises in the New Policies Scenario from $580 billion between today and 2025 to $740 billion each year between 2025 and 2040. The United States accounts for almost 20% of total upstream oil and gas investment globally, followed by the Middle East with almost 15%,” write the authors.
Renewables are said to represent over half of the investment made in power plants since 2010 and will continue to take the largest share of investment in the IEA's NPS, with an average annual of $350 billion.
In the SD scenario, meanwhile, around 15% more capital will be required says the IEA. It will be much more focused on end-use efficiency and clean energy technologies, however.
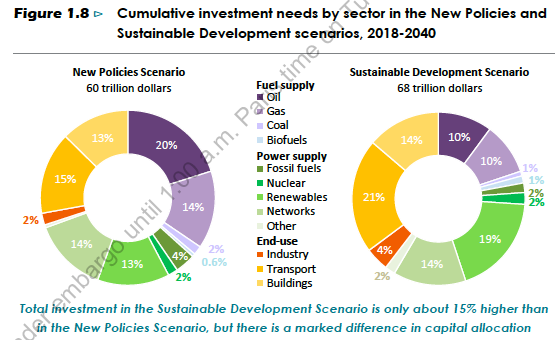
“Electricity demand follows a lower trajectory in the Sustainable Development Scenario owing to increased energy efficiency in all end-use sectors. Continued investment in oil and gas supply, however, remains essential even in the Sustainable Development Scenario to 2040, as decline rates at existing fields leave a substantial gap that needs to be filled with new upstream projects,” continues the agency.
Read something else
The energy transition is complex and uneven, says the IEA. And while the share of renewables has grown, coal consumption is bouncing back and CO2 emissions are again on the rise.
“Untangling the various strands, the New Policies Scenario provides a measure of the real advances that are being made in many countries around the world, as well as the areas in which the world is falling short of some shared objectives to ensure universal access, cleaner air and reduced emissions – an assessment enabled by comparison with the Sustainable Development Scenario,” it says.
As aforementioned, the agency also keenly points out that governments are playing a pivotal role in how our energy futures are shaping up, in terms of investments and policies.
So instead of taking precious time, which the world no longer has, to read through a report, which still pits oil and gas as the main energy players, policy makers should sit down with a coffee and a copy of the Drawdown: The most comprehensive plan ever proposed to reverse global warming. Doing just what it says on the tin, the book presents 100 concrete action plans including the “most substantive, existing solutions to address climate change.”
“What was uncovered is a path forward that can roll back global greenhouse gas emissions within thirty years. The research revealed that humanity has the means and techniques at hand. Nothing new needs to be invented, yet many more solutions are coming due to purposeful human ingenuity. The solutions we modeled are in place and in action. Humanity’s task is to accelerate the knowledge and growth of what is possible as soon as possible,” writes editor, Paul Hawken.
And it does not include fossil fuels. I know what I would rather read.
pv magazine's regional editors will be publishing more detailed reports throughout the day, so stay tuned for more examination of the IEA's latest World Energy Outlook. Alternatively, check out the Drawdown.
- On pv magazine Australia, you can read how the IEA highlights the viability of Australian ‘green hydrogen’
- For pv magazine India, editor Uma Gupta has reported on a projected doubling in India's energy demand
This content is protected by copyright and may not be reused. If you want to cooperate with us and would like to reuse some of our content, please contact: editors@pv-magazine.com.


the future in Africa is for renewable energy mainly solar application