As demand strengthens, we expect to see diversification with the number of GW-scale markets increasing from six in 2016 to 16 in 2019, while the total market share of the top five markets combined will decrease from 81.4% to 65%.
In contrast to the diversifying market, supply chains will continue to concentrate in Asia. According to EnergyTrend’s database, China accounted for 69% and 64% of global cell and module capacities, respectively, while the whole Asian region (excluding India) accounted for 92% and 85%, respectively.
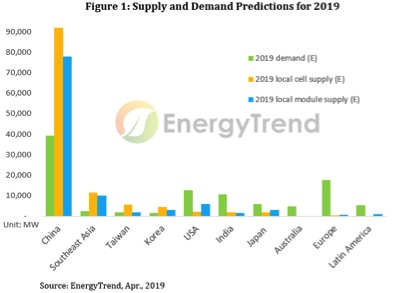 Further analysis on supply and demand of the major markets in 2019 shows that China, Southeast Asia, Taiwan and Korea are all regions of oversupply, while the United States, India and European countries rely on imports from these countries to meet the demands of their markets.
Competitiveness under trade barriers
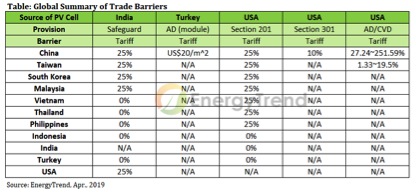
Since 2012, solar trade barriers have had a constant impact on international trade relations. Last year saw further dramatic changes, including the United State’s Section 201 and Section 301 actions, India’s safeguard tariffs, and the elimination of Europe’s Minimum Import Price (MIP), causing the market outlook to remain murky.
Since end markets still exist, those on the supply side are faced with the problem of how to meet them. Looking at the situations of various markets, products from the supply side enter two major approaches:
- Direct exports
No limitations are imposed on exports or imports in countries that don’t raise trade barriers, such as Australia, Japan and Southeast Asian countries. Purchasers in these markets prioritize aspects, such as price-performance ratios, brands and warranties, and power quality. China’s tier-1 brands hold the greatest advantage in these aspects.
- Tariffed exports
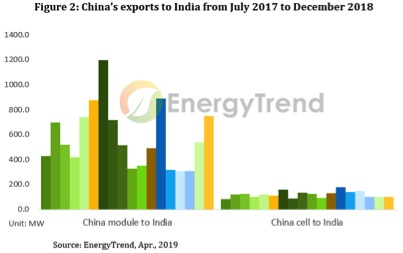
India introduced a safeguard tariff on July 26, 2018. However, China’s export data shows that although India’s demand reached a low point due to its shifting policies between August and October, imports made a clear recovery from November onwards. There is still a demand side gap in India’s market, and China’s multi-Si module prices still manage to stay below US$0.29/W after applying the tariff, proving India’s safeguard duty to be defensively deficient. Only the tariff-free modules from Vietnam and Thailand have a chance to compete with tariffed Chinese modules.
 Another case: The United States, which has domestic capacities of 2.5 GW for cells and 6.6 GW for modules, still requires a further 10 GW and 5.9 GW in exports, respectively, to satisfy the estimated 12.5 GW of demand in 2019.
Although products from Turkey, India and certain countries are completely tariff-free, they are limited in capacities and price performances in contrast with mainstream Asian vendors. This means the United States will definitely import products from Asia: After the annual 2.5 GW tariff-free quota has been consumed, tariffed products will have to be imported.
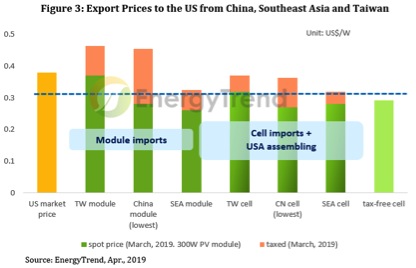
By analysis of cell prices in Taiwan, Mainland China and Southeast Asia, the most competitive products are Southeast Asian cells assembled into modules in the United States, as shown by the blue line in Figure 3 (below). Those assembled in Southeast Asia and directly shipped to the United States come second.
Mainland China and Taiwan are still covered by the anti-dumping and countervailing duties (AD/CVD) imposed by the United States. Taiwanese companies currently have combined tax rates between 26.33 – 49.5%, while China’s capacity has combined tax rates between 62.24–286.59%.
Since Taiwanese products are priced higher, their after-tax prices are nearly on par with China’s (calculated by the lowest tax rate). However, Taiwan’s exports toward the United States consist mainly of cells, while China’s consist mostly of PV modules; both countries don’t compete with each other directly, but primarily with Southeast Asian capacities in cells and in module sectors, respectively.
 Apart from the previous two modes of export, trade barriers may also result in supply replacement and crowding. For example, India’s safeguard tariffs block Malaysian capacity. If this causes a gap in supply, this may be filled by capacities from neighboring and tariff-free Vietnam and Thailand, or even China, where prices still remain low, even after applying tariffs.
Crowding, on the other hand, is most pronounced in Europe. China’s product prices have been falling since the “May 31 Policy”. Europe’s MIP ended on September 3, 2018, so China’s products became extremely competitive in the European market once again.
The market share of Made in China products grew to over 50% in October 2018, clearly crowding out those from Taiwan, Korea and Southeast Asian regions.
China’s production capacity dominates the market, while Southeast Asia boasts the most flexible supply
 Different places of origin have different limits, along with differing production costs and spot prices. As the supply chain experienced dramatic price drops – beginning in the second half of 2018 – product flows became turbulent across the globe under the various trade barrier strengths of each country. Therefore, China’s products now dominate the global market, due to their competitive price-performance ratios.
Taiwan focuses on cell exports with rather high production costs and less competitive prices, thus threatening its range of export markets. By comparison, Southeast Asian production capacities have the advantage of lower production costs, steady supply and a larger selection of export markets.
Possessing the highest flexibility in supply, Southeast Asian manufacturers can adjust shipment flows according to real market situations, even in regions with trade barriers.
Established in 2010, EnergyTrend focuses on industries associated with renewable energy, analyzes new energy solutions, energy storage systems, and plug-in vehicles, while tracking the prices and shipments of lithium batteries. Particularly, we specialize in photovoltaic industry research, track prices of solar PV cells/modules, changes in global solar PV capacity, economic conditions, and policy/strategy updates, helping the energy sector make decisions on solar PV investments. For more information, please visit www.energytrend.com
The views and opinions expressed in this article are the author’s own, and do not necessarily reflect those held by pv magazine.
This content is protected by copyright and may not be reused. If you want to cooperate with us and would like to reuse some of our content, please contact: editors@pv-magazine.com.


1 comment
By submitting this form you agree to pv magazine using your data for the purposes of publishing your comment.
Your personal data will only be disclosed or otherwise transmitted to third parties for the purposes of spam filtering or if this is necessary for technical maintenance of the website. Any other transfer to third parties will not take place unless this is justified on the basis of applicable data protection regulations or if pv magazine is legally obliged to do so.
You may revoke this consent at any time with effect for the future, in which case your personal data will be deleted immediately. Otherwise, your data will be deleted if pv magazine has processed your request or the purpose of data storage is fulfilled.
Further information on data privacy can be found in our Data Protection Policy.