From pv magazine USA.
We’re a long way from the land of milk and honey but on Easter Sunday – for about an hour – we got a taste of the promised land.
On Sunday, at 1.55pm Pacific time, grid operator the California Independent Systems Operator (CAISO) reported the greenhouse gas emissions necessary to serve its demand – around 80% of California’s electricity demand on an annual basis – was measured at minus-16 mega tons of CO² per hour. Five minutes later, the value was -2 mTCO²/h, before it crept back up to 40 mTCO²/h at 2.05pm. At 2:10pm, it fell back to -86 mTCO²/h and stayed negative until 3:05pm.
The information was brought to the attention of pv magazine via a tweet from eagle-eyed reader Jon Pa, after CAISO’s site first noted the negative values:
@SolarInMASS California ISO has negative CO2 emission Easter Sunday afternoon. pic.twitter.com/QoCZNZ5kOR
— Jonathan Papai (he/him) (@JonathanPapai) April 21, 2019
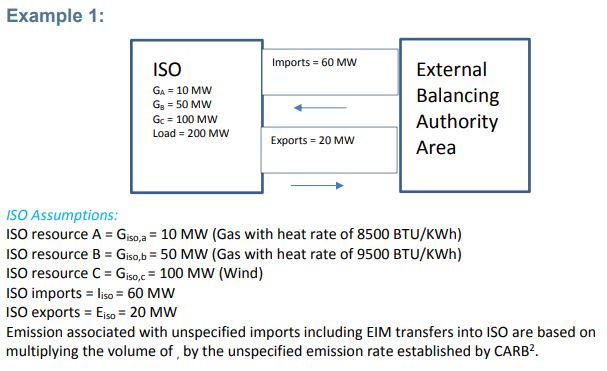
The region was still generating CO² though, as natural gas, biogas, biomass, geothermal and even coal plants were running and pumping out emissions. CAISO’s Greenhouse Gas Emission Tracking Methodology, December 28, 2016 notes the below calculations to create the value of what it terms, “Total GHG [greenhouse gas] emissions to serve ISO demand”:
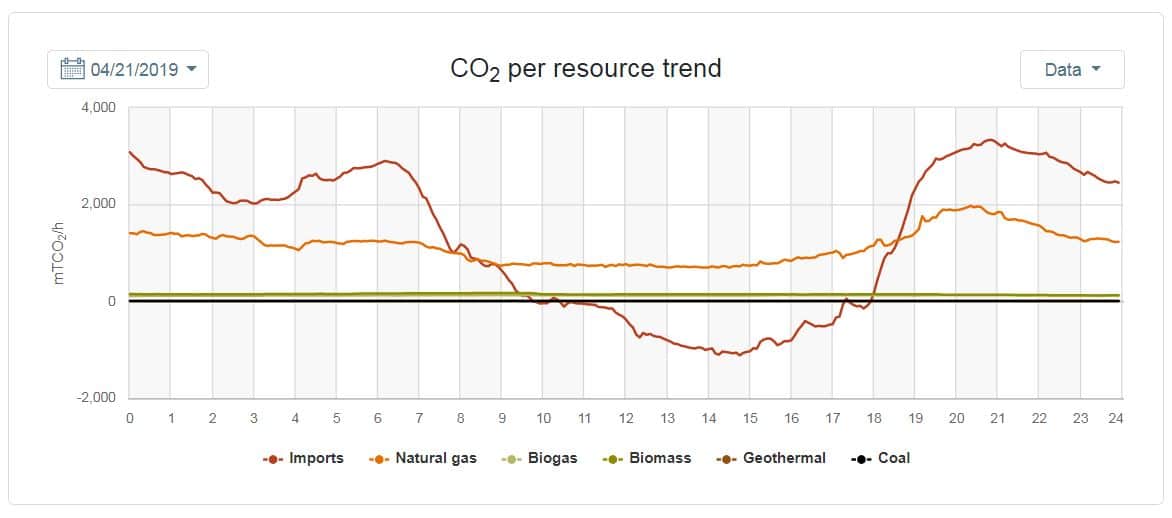
Of importance to note is that to get to the net negative value, CAISO considered all electricity imports and exports. And as can be noted in the image below, the CO² intensity of imports during the day rapidly declined as the sun came up, first going negative around 9.05am, and mostly staying so until just before 6pm.
During the same weekend other records were noted – reemphasizing the point made recently by pv magazine that we’re in record setting season – such as a new electricity export record of greater than 2 GW and renewable electricity contributing more than 70% of total demand.
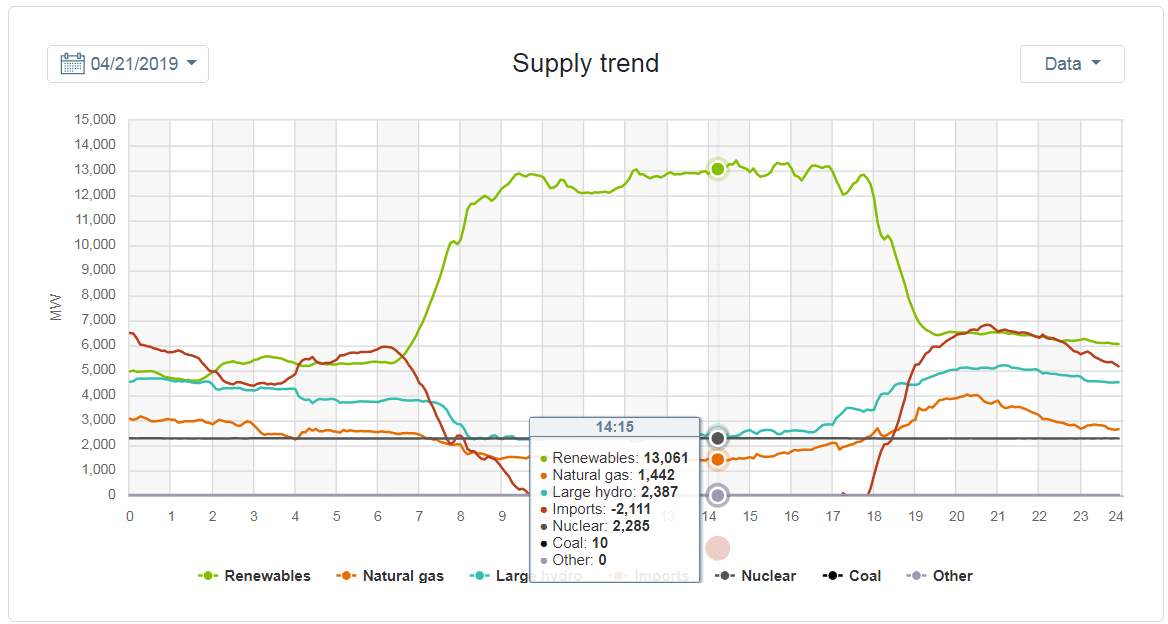
At the peak negative moment of 2.15pm, -112 mTCO²/h seen below, the total amount of clean, instantaneous generation being used in the power grid region was 17 GW, with renewables giving 76% of the total, hydro 14%, nuclear 13% and imports of -12% countering the CO² from just over 1.4 GW of gas generation.
Also of importance are a few layers of nuance in the electricity demand charts. First off, we’re in the shoulder seasons of California – nice cool weather before the warmth of summer drives air conditioning demand. Additionally, weekend electricity demand is always lower, and Easter Sunday may have had an effect.
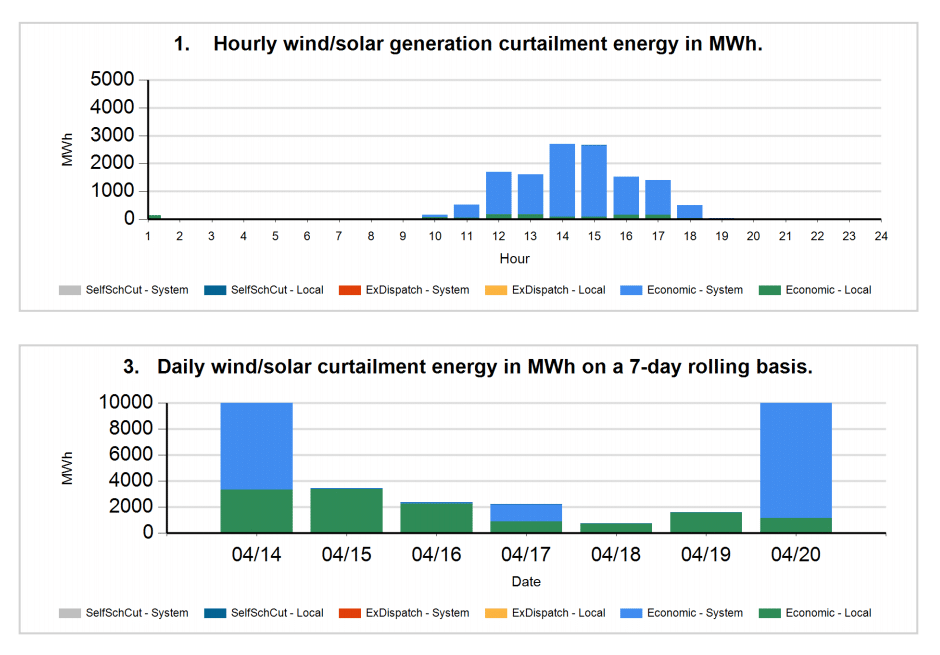
Lastly to note was the amount of electricity from solar and wind generation being curtailed. And while the Sunday numbers weren’t available yet, the below image noted Saturday saw 10 GWh in total curtailed – peaking at more than 3.2 GW of instantaneous, mostly solar power, in the hours of 12 and 1pm. On an annualized basis, less than 2% of total potential solar electricity was curtailed in 2018.
This content is protected by copyright and may not be reused. If you want to cooperate with us and would like to reuse some of our content, please contact: editors@pv-magazine.com.

2 comments
By submitting this form you agree to pv magazine using your data for the purposes of publishing your comment.
Your personal data will only be disclosed or otherwise transmitted to third parties for the purposes of spam filtering or if this is necessary for technical maintenance of the website. Any other transfer to third parties will not take place unless this is justified on the basis of applicable data protection regulations or if pv magazine is legally obliged to do so.
You may revoke this consent at any time with effect for the future, in which case your personal data will be deleted immediately. Otherwise, your data will be deleted if pv magazine has processed your request or the purpose of data storage is fulfilled.
Further information on data privacy can be found in our Data Protection Policy.