Cost of developing renewables in Southeast Asia put through new mapping tool


To realize the regional goal of generating 23% of energy from renewables within six years, quality data and analyses are needed to support investment decisions made by member states of the Association of Southeast Asian Nations (ASEAN).
One such piece of analysis has used a new mapping application to visualize the costs of developing solar and wind projects in the region.
In what has been billed as the first spatial estimate of the cost of generating electricity from solar and wind in ASEAN countries, the Exploring Renewable Energy Opportunities in Select Southeast Asian Countries: A Geospatial Analysis of the LCOE of Utility-Scale Wind and Solar PV report provides insight into the role renewable energy resource quality and other factors may play in generation costs.
The analysis, developed by the U.S. Agency for International Development and the U.S. National Renewable Energy Laboratory found abundant potential for utility scale, solar and onshore wind development across Southeast Asia.
The study found potential solar capacity exceeds 41 TW – 59,386 TWh annually – and the wind capacity figure topped 1.8 TW. According to the findings, PV costs will range from $64 to $246/MWh and wind costs $42-221/MWh.
To calculate the economic feasibility of developing such resources, the report used the newly developed Cost of Energy Mapping Tool. The application provided insights into the role played by factors such as renewable energy resource quality, installation costs, fixed operations and maintenance cost, debt and depreciation.
Regional cost of solar electricity
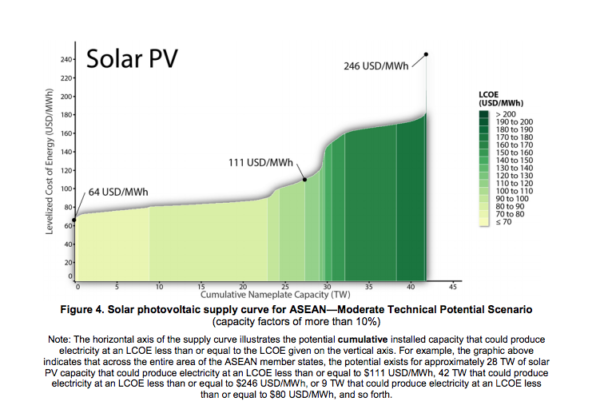
In the report’s ‘moderate technical potential’ scenario, the levelized cost of electricity (LCOE) for solar ranged from $64/MWh ($0.064/kWh) in Vietnam to more than $200/MWh in Indonesia. The lowest LCOE values were seen in Vietnam, Burma, Thailand and Cambodia, with minimum solar electricity generation costs of approximately $64, $70, $80, and $82/MWh, respectively.
The variation occurred as a result of solar energy resource quality plus assumed economic (inflation and tax rates) and techno-economic (installation and operation and maintenance costs) values for each country. Higher LCOEs in Indonesia arose mostly from assumed installed costs for PV in the country.
As shown in Figure 4 below, the total potential, cumulative installed capacity of solar in all ten ASEAN member states had a maximum LCOE of $246/MWh – corresponding to a minimum capacity factor of 10% in the region of approximately 42 TW. The minimum LCOE observed was $64/MWh and the median $111/MWh.
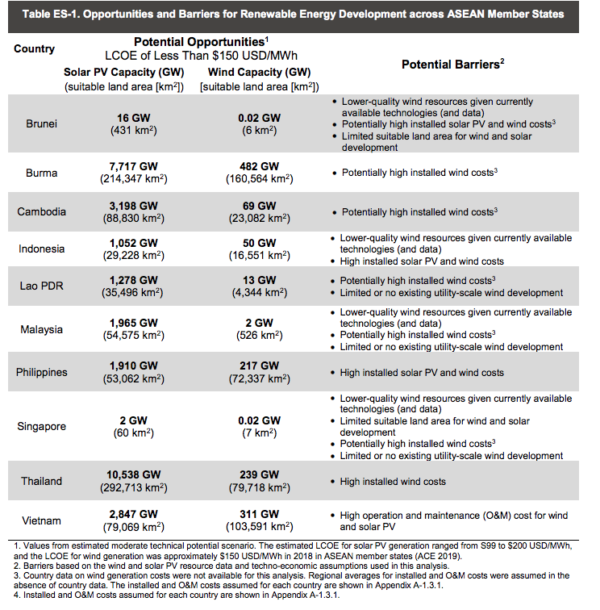
On a country level, the biggest potential opportunities – with an LCOE of less than $150/MWh and suitable land for PV projects – were Thailand (with a potential 10,538 GW cumulative capacity) followed by Myanmar (7,717 GW) and Cambodia (3,198 GW). Barriers were reflected by potentially high installed PV costs in Brunei, Indonesia and the Philippines, and in high operation and maintenance costs in Vietnam.
The mapping tool used to calculate the values aims to support decision makers in setting renewable energy targets, developing enabling policy and mobilizing private sector investment and could prove particularly handy in the ASEAN region.
The ASEAN goal of generating 23% of energy from renewables by 2025 is seen as feasible. In last year’s Renewable Energy Market Analysis: Southeast Asia report, the International Renewable Energy Agency found the target attainable provided better policy and investment frameworks are established. Current regional policies suggest the share of renewables in total primary energy supply will jump to just below 17% by 2025, from less than 10% in 2014, that study found.
This content is protected by copyright and may not be reused. If you want to cooperate with us and would like to reuse some of our content, please contact: [email protected].

Please login to comment
[…] back to December 2016, Scatec Solar entered the Malaysian solar market, and in partnership with Itramas Corporation SDN BHD, the solar integrator signed a 21 year PPA […]
[…] Cost of developing renewables in Southeast Asia put through new mapping tool pv magazine International […]
[…] has analyzed the costs of developing utility scale … Source: Renewable Resources Cost of developing renewables in Southeast Asia put through new mapping tool – pv magazine Int… Cost of developing renewables in Southeast Asia put through new mapping tool – pv […]
[…] back to December 2016, Scatec Solar entered the Malaysian solar market, and in partnership with Itramas Corporation SDN BHD, the solar integrator signed a 21 year PPA […]