Empirical approach shows PV is getting cheaper than all the forecasters expect

Energy-transition forecasts have regularly fallen short in the past. The global change in energy supply is taking place faster than expected but such knowledge has not led to more accurate forecasts.

DR Dahlmeier Financial Risk Management AG
With empirically-based modelling the most reliable approach, DR Dahlmeier Financial Risk Management has applied it to the anticipated growth of PV to 2030 – with surprising results.
Previous technological transitions, as analyzed by Doyne Farmer and his Oxford University team, have begun with exponential growth followed by linear growth before levelling off, in a characteristic “s-curve.”
The volume of PV deployed worldwide has roughly doubled every two years over the past 48 years. Each doubling has brought a price reduction of around 23% and there is little variance from that pattern.
At some point the incline should become more gentle but when will that happen for solar?
The graph below shows the energy markets where new-build solar or wind sites were cheaper than new coal and gas power plants, during the first half of 2022. Current solar panel prices already make the estimates used below look costly.
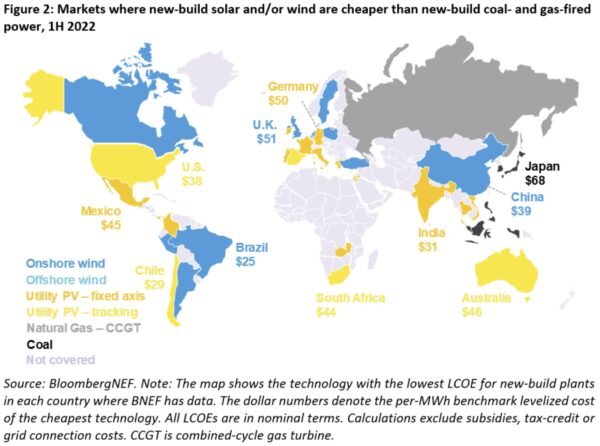
Source: BloombergNEF
In almost all industrialized countries, wind or solar energy is the cheapest source of electricity from new large-scale plants. Photovoltaic power plants undercut production costs of around $0.01/kWh in 2020, in sunny regions, and the current PV price trend enables even lower production costs. The average costs shown in the Bloomberg chart above could be significantly undercut with new systems. Since November 2022 alone, PV module prices have roughly halved, to a record low. To put that into perspective, electricity prices on the European Energy Exchange in Leipzig averaged €30 ($32.64) per megawatt-hour in 2020 and have fluctuated between €77/MWh and €102/MWh since March 2023. Photovoltaic electricity from large systems has, therefore, not only long been competitive it is now by far the cheapest source of electricity from new systems.
Pricing is different for small systems, where final electricity consumption price is the decisive factor. Self-generated solar power is already cheaper than grid electricity almost everywhere, making home solar systems economically attractive.
Solar module prices have fallen more than 99.8% since 1976. Study of almost 3,000 forecasts has revealed just how unambitious analysts have been in predicting solar panel price declines. Between 2010 and 2020, the most ambitious analysts predicted a 6% annual fall in price, with predictions averaging out at 2.6% per year. Prices actually retreated 15% per year.
Those inaccurate price predictions affected the resulting solar deployment forecasting models, particularly the integrated assessment models (IAMs) which dominate economic modelling. pv magazine has reported on unambitious modeling and forecasts, particularly by the IEA.
What alternative modelling approaches exist?
Using an empirical approach, my team estimates solar’s exponential expansion phase will continue beyond 2030. We expect the volume of installed solar generation capacity to rise from 1.24 TW, in 2022, to around 14 TW in 2030. The module price will fall from $0.22 per Watt-peak of generation capacity, in summer 2023, to $0.097/Wp in 2030. Global volume will rise by a factor of 11 and the price will more than halve. The following chart shows the expected volume growth and price reduction from 2023 as a forecast based on previous developments.
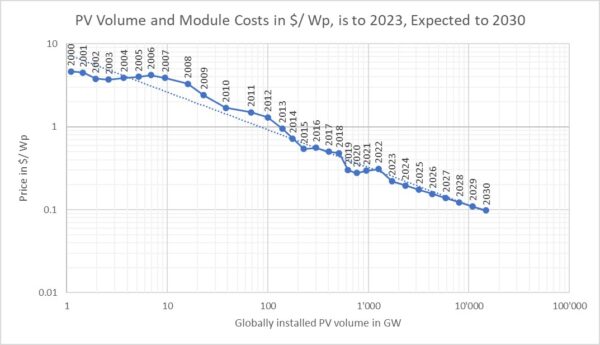
Trend extrapolation from 2023 to 2030, shown in double logarithmic scaling
Conservative estimates indicate the result would be a consistent solar energy generation cost of less than $0.02/kWh in central Europe and below $0.01/kWh in Southern Europe and the southern United States.
Our empirical modelling is characterized by transparent, comprehensible assumptions and lower complexity than the dominant approach. The modelling developed by our team – independently of Farmer, at Oxford University – delivers fundamentally identical results. Thus, our methodology can be regarded as independently validated by that of Oxford University. While other models do not aim to apply to historical development, empirical modelling integrates historical figures and builds on them.

Presentation of the historical and expected development in PV until 2030
The expected deployment figures are reflected in the chart above.
The modelling is based on a large number of technology transitions. Deviations from the trend are possible. Solar development may be faster or slower but the trend provides the expected value, or forecast, of 14 TW globally and a module price of $0.097/Wp. We do not derive any statements about national or regional development from the model at this point.
As pv magazine has reported, non-empirical modelling approaches have prompted much lower forecasts. For example, analyst Wood Mackenzie’s “Q3 2023 Global solar market outlook update” produced a 2030 figure of 3.65 TW of solar. Our estimate is for 2.8 TW of solar in 2029 alone.
pv magazine print edition
Is that too optimistic, given the much-publicized problem of storing electricity generated by intermittent renewables? This issue has been resolved in principle. US-based investor Warren Buffett’s Gemini solar project provides round-the-clock solar power, supported by battery storage, for $0.033/kWh. The ultra-high-voltage, direct current transmission system installed by ABB in China transmits electricity 3,200 km – between Changji and Guquan – with low losses. Those two projects demonstrate 24/7 solar power can be delivered economically almost anywhere. The United Kingdom is planning the “Xlinks Morocco-UK Power Project” and Egypt, Cyprus, and Greece are planning similar infrastructure.
Based on empirical evidence, the long-term global exponential trend for solar is unlikely to slow down before the end of the decade and probably not before 2034, if only due to the favorable prices of solar power from new systems. How this global trend will continue, whether it will increasingly focus on sunny regions, and whether such regions will sell us energy in the form of electricity in the future or whether PV electricity will be produced and stored locally, depends on politics.
Renewables not only have the potential to enable a CO2-neutral economy. They are already a basis for stable economic growth on the path to global climate neutrality and they help to reduce energy costs. We should utilize the opportunities that present themselves, also in terms of limiting climate change and of carrying out our responsibility for the planet.
The views and opinions expressed in this article are the author’s own, and do not necessarily reflect those held by pv magazine.
This content is protected by copyright and may not be reused. If you want to cooperate with us and would like to reuse some of our content, please contact: [email protected].
Please login to comment
[…] Da pv magazine Global […]
Still doesn’t account for the absurdly high government subsidies that lower the installed cost AND operational costs, so…. The true cost comes straight out of the consumers pocket and helps the eco-nazis limit or even eliminate cheap clean fossil fuels that are needed to bridge the gap to cleaner methods. Slow down, let the new tech mature and become as reliable as fossil fuels, allow prices to sort themselves out Without artificial support, kind of how the FREE MARKET used to work.
Except the government is also subsidizing other forms of energy. Oil and gas get leases at low rates from government land. They have also been getting tax breaks and subsidies for decades.
Texas is subsidizing new gas fired plants because they are no longer economical to build with the cheap price of wind and solar power. You have to pay for fuel for each kilowatt produced by fossil fuels. No fuel cost for wind or solar.
You mean those highly subsidized fossil fuels? They aren’t so clean either.
Artficially Cheap silver is coming to an end.
Hurry up and apply all of the ridiculous resources and money being wasted on hydrogen and fusion and supply our country with solar power right NOW. The problem with the energy produced by solar is that it is TOO CHEAP, so the powers that be ( existing electrical utilities AND gas and oil ) won’t be able to charge us nearly what we pay now. Also, they won’t have the stranglehold on us that they presently have. Imagine something as simple as not worrying about taking a family vacation in your car because of the cost of fuel.
LIKE I SAID HURRY UP!!!
Great! Time to put those absurdly conservative estimates of solar from the likes of IEA to bed once and for all.
Yet… At these reduced costs where is my affordable self install kit or local roofing company add on for my house, why have CA installs gone down 80% because the buy back rate has been lowered (if so much cheaper they should now be cost effective w/o incentives, perhaps requiring storage system vs utility feedback . How does an individual make this more actionable than the rip off offers to lease on a 20 yr lock in that were so prevelant and turned off many and actually made resale of house convoluted. ( I got quotes a few yrs ago and not worth it, is it now? On a purchase vs lease basis?)