
IRENA’s Renewable Capacity Statistics 2026, published on 2 April, records EU-27 installed renewable capacity at 779 GW as of end 2025, double the 387 GW a decade ago. The fleet has compounded at 8% per year.
Solar PV has been the driving force. From 91 GW in 2016 to 367 GW by end 2025, the EU’s solar fleet has grown at a 17% compound annual rate, adding an average of 57 GW per year over the past three years. In 2025, solar accounted for 80% of all new EU-27 renewable capacity additions: 56 GW out of 70 GW total. Wind contributed 12 GW. Solar PV now makes up 47% of the entire EU renewable fleet.
The top four markets (Germany, Spain, France, and Italy) account for 60% of the installed base. But the build-out is broadening. Poland’s 3.7 GW of solar in 2025 marks a significant shift for a coal-dependent economy. Bulgaria added 1.4 GW, expanding its entire prior fleet by 17% in a single year.

Solar delivers where wind and hydro falter
In 2025, EU renewable output grew by just 21 TWh despite capacity expanding 10%. Wind generation fell 11 TWh as fleet-wide capacity factors dropped from 24.6% in 2024 to 22.8% in 2025. Hydro lost 43 TWh from below-average rainfall across Southern and Central Europe. Solar was the sole technology that delivered more electricity year-on-year: 69 TWh more, a 24.6% increase, nearly offsetting the combined 54 TWh decline from wind and hydro. (Data based on Eurostat)
At scale, solar is the most predictable large renewable technology on the grid. EU-wide solar capacity factors have held within a tight band of 11.4% to 12.0% for three consecutive years. Wind is far more variable: at 244 GW of installed capacity, a single percentage-point swing in EU wind capacity factors moves generation by 21 TWh.
Batteries, grid, and the merchant revenue problem
Midday price cannibalization is structural. In Spain, Germany, and increasingly Italy and Greece, wholesale day-ahead prices regularly fall to zero or below during peak solar hours in summer months. Each of these key markets recorded over 500 hours of negative prices in 2025. The result is that straightforward merchant returns from solar are disappearing. Corporate offtakers holding virtual PPAs are experiencing the same revenue erosion, as capture prices fall in step with market saturation.
The assumption that grid expansion alone can solve solar oversupply does not hold under scrutiny. Figure 1 shows Germany’s cross-border electricity flows on Sunday 5 April 2026, a day when renewables exceeded domestic demand. German net exports ran at 8 to 9 GW overnight but collapsed to near zero during the midday solar peak. Poland and Czech Republic, which had been absorbing German surplus through the night, reversed direction and began pushing power back into Germany.
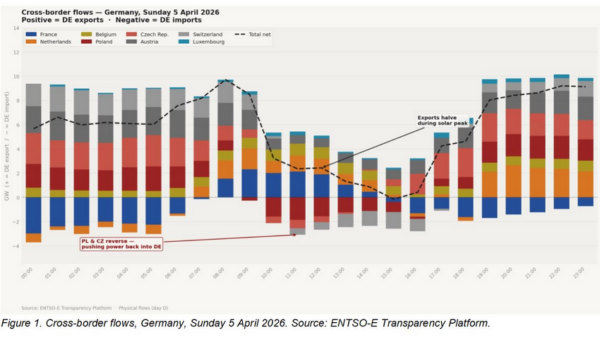
The cables were not congested. Transmission capacity was available. The problem was that every neighboring market was also in surplus at the same time. When solar peaks simultaneously across central Europe, there is no price gradient to move power against. Interconnection enables cross-border trade, and Europe needs more of it for balancing variability and maintaining security of supply. But additional cables cannot solve a situation where every connected market is oversupplied during the same hours.
The challenge has shifted from building renewable capacity to integrating what is already being built. This means managing the merchant, storage, and grid risks that accompany deep solar penetration, and making informed investment decisions in a market where the fundamentals have changed. Every EU member state has its own grid code, storage licensing regime, and ancillary services market design, navigating these differences, understanding where storage is profitable, where grid bottlenecks are binding, and where regulatory frameworks are evolving, is where substantive value now lies.
Quantifying the risks: how can Ricardo`s Electricity Market Outlook help?
Revenue modelling without credible curtailment and cannibalization projections is not fit for purpose. These are not tail risks to be footnoted in a sensitivity analysis. They are primary determinants of project returns.
Ricardo's Electricity Market Outlook is based on the proprietary PRIMES-IEM model, which runs all European markets simultaneously to deliver hourly prices out to 2050. Cross-border flows are derived by replicating the EUPHEMIA algorithm used by ENTSO-E. Built on a framework behind 20 years of European Commission policy analysis, the Electricity Market Outlook provides capture rate, negative price, and BESS profitability projections at country and asset level across EU markets.
For investors, developers, and offtakers navigating a market where both battery economics and grid constraints shape project viability, the Electricity Market Outlook supports curtailment analysis, storage investment cases, and regulatory engagement with the quantitative foundation that bankability assessments require.
Author: Safa Sen, Market Engagement Lead For CWE at Ricardo, Member of WSP.
Ricardo is a member of professional service firm WSP Group, uniting engineering, advisory and science-based expertise to shape communities to advance humanity. From local beginnings to a globe-spanning presence today, it operates in over 50 countries and provides solutions and delivers innovative projects across sectors: Transport & Infrastructure, Property & Buildings, Earth & Environment, Water, Power & Energy and Mining & Metals.
The views and opinions expressed in this article are the author’s own, and do not necessarily reflect those held by pv magazine.
This content is protected by copyright and may not be reused. If you want to cooperate with us and would like to reuse some of our content, please contact: editors@pv-magazine.com.

By submitting this form you agree to pv magazine using your data for the purposes of publishing your comment.
Your personal data will only be disclosed or otherwise transmitted to third parties for the purposes of spam filtering or if this is necessary for technical maintenance of the website. Any other transfer to third parties will not take place unless this is justified on the basis of applicable data protection regulations or if pv magazine is legally obliged to do so.
You may revoke this consent at any time with effect for the future, in which case your personal data will be deleted immediately. Otherwise, your data will be deleted if pv magazine has processed your request or the purpose of data storage is fulfilled.
Further information on data privacy can be found in our Data Protection Policy.