US FERC counts 48 GW-AC of large solar projects planned by 2021

Just as the experts were completely caught off guard by the capacity of solar PV installed globally in 2017 (~75 GW projected versus the almost 100 GW installed), there are indicators that over the next three years, the United States will blow current projections out of the water.
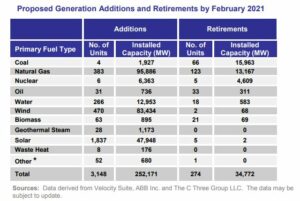
The Federal Energy Regulatory Commission’s (FERC’s) monthly Energy Infrastructure Update for January, reports that there are 47,948 MW-AC (~ 60 gigawatts DC) of utility scale (>1 MW) solar projects planned for the next three years, across 1,837 projects. The average project size is just over 26 MW-AC, and the average volume per year is 15,982 MW (~ 20 GW DC).
(FERC’s solar power ratings are in AC values whereas most industry projections are in DC values, as such, for the rest of this article, we will use an AC:DC ratio of 1.25 – meaning the 47,948 MW-AC is approximately 59,935 MW-DC.)
This volume of solar projects contrasts with the most recent projections from GTM Research that the United States will install a total of ~20.5 GW utility scale solar power in the same time period – versus the yearly average of 20 GW that FERC has collected proposals for. Additionally, this most recent report from GTM Research suggests that the whole of the United States won’t return to the 15 GW of solar power installed in 2016 in a single year until 2023 – and in that year they’re projecting only 7-8 GW of utility scale solar.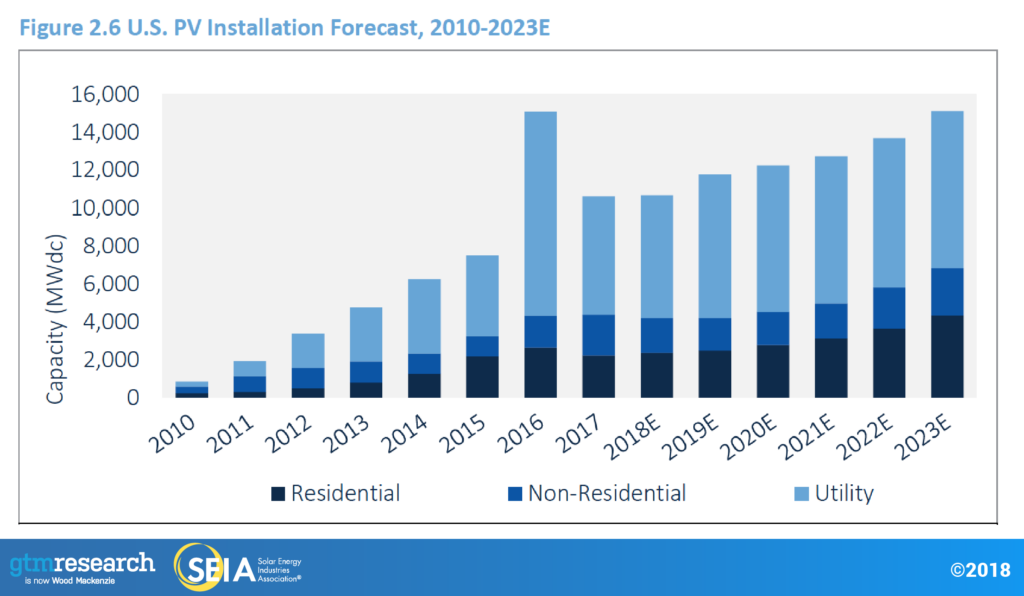
FERC’s report first began projecting utility-scale energy infrastructure upgrades in August of 2017. Interestingly, in that report there were more projects proposed – 1,892 versus this month’s report at 1,837 – but only 54 GW of proposed volume. Some of this change doubtless came from projects that were completed during the year and new projects proposed, though it is also possible that some projects were withdrawn.
Six GW of utility-scale solar power is approximately what GTM Research projects will be installed in all of 2018.
One potential driver for an uptick in utility solar projects getting built is that the current 30% Investment Tax Credit starts to drop after 2019. For projects that begin construction in 2020, the tax credit falls to 26% and in 2021, it falls to 22%. Thereafter, a permanent 10% tax credit stays in place for commercial and utility-scale projects. This tax credit expiration (which was extended) was the major driver for utility-scale installations in 2016.
Projects that have commenced construction before the end of their respective tax year will get the tax credit assigned to that year, as long as the project is placed in service before the end of 2023.
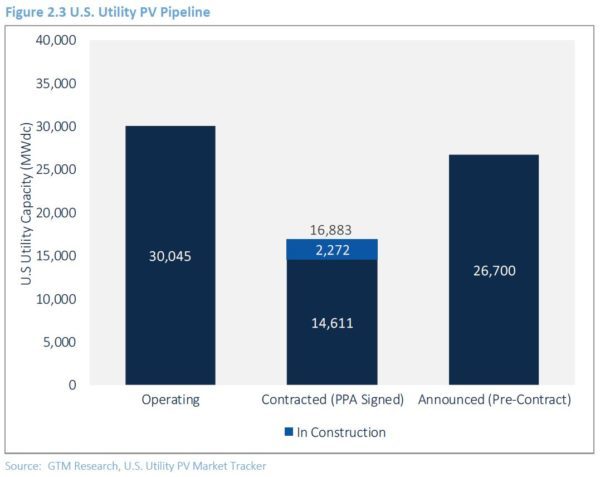
One reason for a disconnect between the FERC number and professional projections could be that FERC proposed projects have a lower probability of getting built than what research groups like GTM Research consider viable. For instance, in GTM Research’s 2017 U.S. Solar Market Insight report – a 43 GW pipeline of utility scale projects are noted, however, 26 GW worth of projects are announced, but have not yet signed a contract with the electricity off taker.
GTM argues in its 2017 report: “Existing power-purchase agreements for 2019 and 2020 that structured contracts with module pricing assumptions below $0.40/W will be at a high risk of cancellation or delay. (…) Developers are likely to push out completion dates of 2019 or 2020 projects into 2020, 2021 or later to leverage the tariff stepdown, resulting in depression of expected capacity additions.”
Since most of these projects were proposed to FERC prior to the solar panel import tariff, the fallout seems to be determined.
If we were to stick with GTM Research’s projection of ~15.5 GW for residential/commercial projects, and add the FERC volume of ~60 GW, we’d then have a projection of 75.5 GW through the next three years – an average of ~25 GW.
This volume would have the U.S. doubling cumulative installed capacity in two years, probably a bit strong of a volume for an industry usually in the 2.5-3 years doubling rate globally.
Johannes Bernrauter, owner of Bernreuter Research, suggested we ought consider 50% of the FERC projects when building a forward looking projection, meaning ~45 GW of solar over the next three years. Johannes broke the volume by year down to: 2018 – 11 GW, 2019 – 13-14 GW and 20-21 GW in 2020. Johannes further commented,
Maybe, 2020 will get still higher due to the 2019 commence-construction rule, but the ITC drop from 30% to 26% does not appear so huge as to ignite a doubling of the 2019 annual installation volume in 2020.
Its starting to look like 2020 might be a real big year for the U.S. solar power industry.

Please login to comment
And 6 new nuclear reactors before Feb 2021?
And 96 GW NG before Feb 2021?