Canada’s Ministry of Natural Resources has launched an open-source web-mapping application that provides estimates of photovoltaic potential and daily global insolation rates for any location in Canada.
The maps – designed by the Canadian Forest Service, the CanmetENERGY Renewable Energy Integration group, and the Federal Geospatial Platform – also include data provided by Environment and Climate Change Canada.
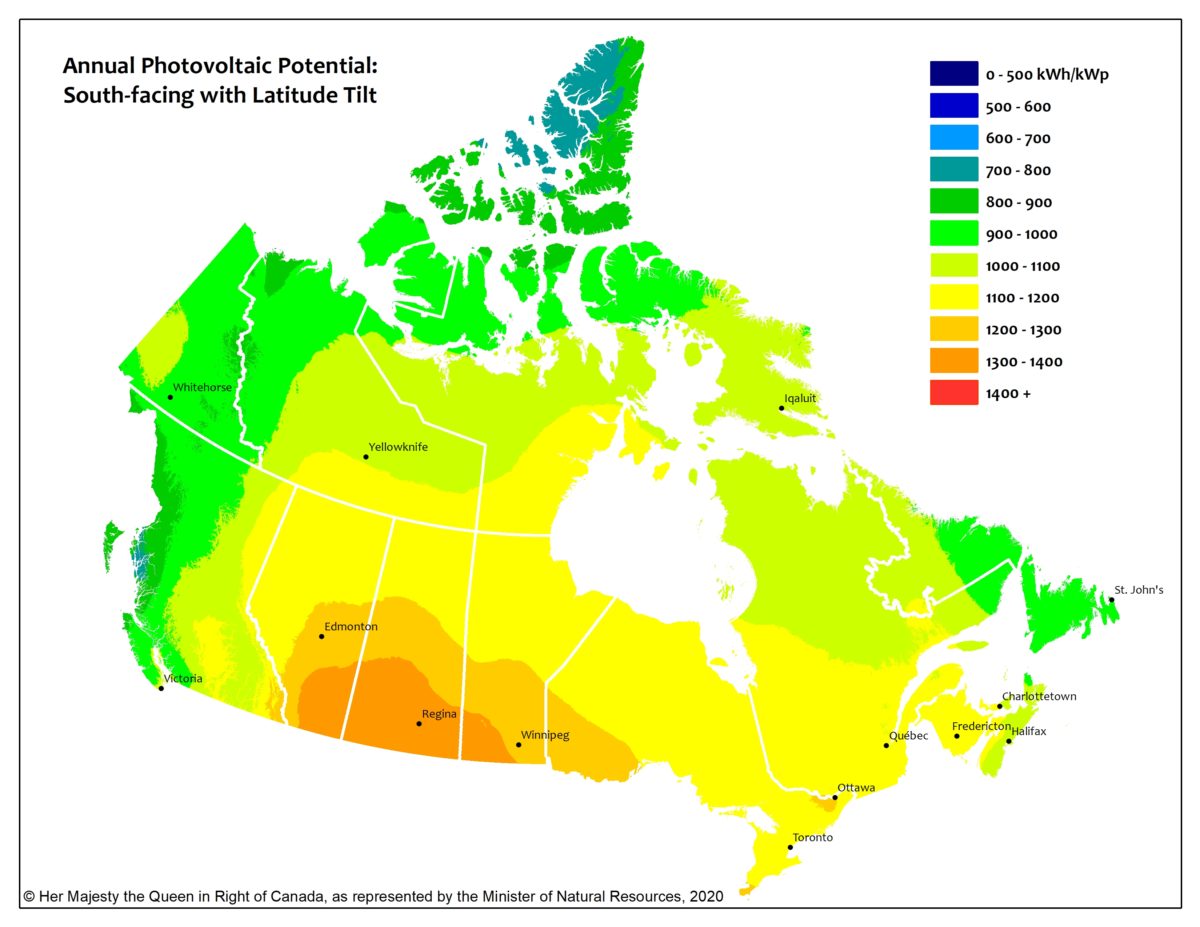
“The maps are presented for each month and for the entire year, for six different PV array orientations: a sun-tracking orientation, a horizontal orientation and four fixed South-facing orientations with latitude, vertical (90 degrees) and latitude ± 15-degree tilts,” the ministry said.
The tool also allows users to collect data on single municipalities from a dataset of 3,500 municipalities. Alberta, Manitoba and Saskatchewan are the provinces with the highest solar radiation levels.
However, the Economics of Solar Power in Canada report, published in late 2018 by the Canadian National Energy Board, stated that the financial break-even point for commercial solar and community projects was lower in Nova Scotia, Ontario and Prince Edward Island than in other provinces.
The researchers found that rooftop PV, in a low-cost future scenario, is expected to save homeowners and businesses money in many Canadian communities. Utility-scale solar also becomes viable in many places in a low-cost scenario, although it may still still require fewer provincial transmission fees, or none at all.
According to the International Renewable Energy Agency (IRENA), Canada had 3.31 GW of installed capacity by the end of 2019. Most of this capacity is located in Ontario, which has supported solar through a feed-in tariff scheme that is now expired.
This content is protected by copyright and may not be reused. If you want to cooperate with us and would like to reuse some of our content, please contact: editors@pv-magazine.com.


One big issue up here in Canada is not the sun, but the Provincial Government who removed the subsidies from any roof installation; there is a conflict of interest when the major shareholder of Hydro One ( the main producer of electrical energy with mostly nuclear operations) , why should they create a competition? it would not be in the Major Share Holder interest! I have not heard of any federal subsidies either ! Add to this the wind power companies who are told to stop producing electricity at certain time of the day, because the nuclear has priority on the grid which is also owned by HydroOne.
In the USA all the quotes in the media show a heavy subsidy, making it affordable to install especially with new technologies on storage and more efficient photo voltaic roof tiles.
Lastly new systems have to be certified by Electrical Authorities, controlled by Provincial Gov, and the electrical engineer’s fees are very high . NO ONE TALKS ABOUT THOSE EMBARRASSING ISSUES in the media, journalist should deeply investigate and publish the findings, ONLY embarrassment make GOV’s change the mind of the “mandarins” of the administrations.
The 2018 report was probably using 2017 data and beyond (back not forward) therefore out dated and giving the perishable information to decision makers.