





Average solar LCOE increases for first time this year
Solar and wind are still the most affordable sources of electricity, but their LCOE has increased for the first time in 2023, according to a new report by US-based financial firm Lazard.
The report offers a comparative LCOE analysis for various generation technologies on a $/MWh basis, with exceptions for US federal tax subsidies, fuel prices, carbon pricing, and the cost of capital. The report also includes a cost-of-firming-intermittency analysis for the first time. Unlike in previous years, the LCOE for utility-scale solar omits thin-film technology and only focuses on crystalline silicon.
In a base comparison, without considering subsidies, fuel prices, or carbon pricing, utility-scale solar and wind have the lowest LCOE of all sources. Utility-scale solar PV comes in anywhere from $24/MWh to $96/MWh, while onshore wind registers the lowest possible LCOE over the shortest range, from $24/MWh to $75/MWh. Offshore wind’s LCOE ranges between $72/MWh and $140/MWh.
For comparison, under the same criteria, gas peaking comes in at $115/MWh to $221/MWh, nuclear is $141/MWh to $221/MWh, coal is $68/MWh to $166/MWh, and gas combined cycle is $39/MWh to $ 101/MWh, according to Lazard.
Unsubsidized residential rooftop PV has an LCOE between $117/MWh and $282/MWh, while the LCOE of community and commercial and industrial (C&I) solar ranges between $49/MWh and $185/MWh. When factoring in federal tax subsidies under the US Inflation Reduction Act, including domestic contest provisions, rooftop PV comes in at $74/MWh to $229/MWh, and community/C&I rooftop PV at $32/MWh to $155/MWh.
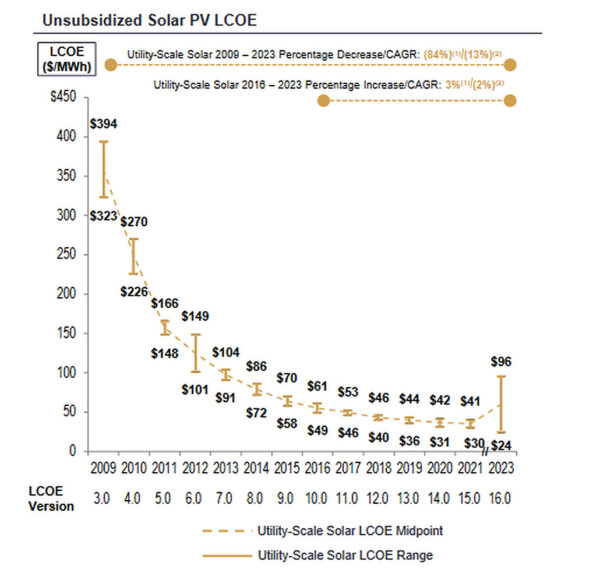
For the first time in the history of Lazard’s analysis, the average LCOE for both utility-scale PV and onshore wind increased. Inflation, supply chain challenges, and the global energy crisis all had a role to play in putting a stop to solar’s “race to the bottom.” Nevertheless, Lazard notes that “the LCOE of the best-in-class onshore wind and utility-scale solar has declined at the low-end of our cost range, the reasons for which could catalyze ongoing consolidation across the sector.”
For utility-scale PV, the LCOE range in 2021 was very small, at $30/MWh to $41/MWh. In 2023, it ranged from $24/MWh to $96/MWh, thereby increasing the average LCOE.
Lazard estimates that between 2016 and 2023, utility-scale PV’s LCOE increased by 3%, calculated as the average percentage increase of the high-end and low-end of the LCOE range. Between 2009 and 2023, however, solar’s LCOE decreased by 84% according to the same metric.
The new report also includes an analysis of the levelized cost of storage and hydrogen, which pv magazine will cover in separate articles.
This content is protected by copyright and may not be reused. If you want to cooperate with us and would like to reuse some of our content, please contact: [email protected].
Please login to comment
[…] increase in average solar LCOE since 2012, up to around $42/MWh according to PV Magazine.2 However, solar remains highly cost-competitive with fossil fuel electricity generation in many […]
[…] the first time in over a decade to $0.07/kWh, largely due to higher commodity and freight prices (source). However, solar PV remains one of the lowest cost options for new power generation capacity in many […]
[…] According to data from the International Renewable Energy Agency (IRENA), the global weighted average levelized cost of electricity (LCOE) for newly commissioned utility-scale onshore wind projects fell by 5% between 2021 and 2022, from $0.035/kWh to $0.033/kWh (https://www.irena.org/Publications/2023/Aug/Renewable-Power-Generation-Costs-in-2022). However, analysis from PV Magazine shows that in early 2023, average utility-scale solar LCOE increased for the first time this year, rising from $24/MWh to $96/MWh. Onshore wind LCOE also increased from $24/MWh to $75/MWh (https://www.pv-magazine.com/2023/04/14/average-solar-lcoe-increases-for-first-time-this-year/). […]
[…] to the Levelised Cost of Energy (LCOE), solar and wind are the cheapest forms of electricity generation right now. Solar panels are […]
Look at the low end of the standard deviation bar.
[…] solar LCOE increases for first time this year | pv magazine A new report by Lazard compares the levelized cost of energy (LCOE) for various generation […]
[…] production levels lower than green hydrogen,” said Lazard and Roland Berger in a new study. The LCOE report then analyses the levelized cost of green and pink hydrogen using PEM and alkaline electrolyzers […]
[…] Read More […]
[…] decrease than inexperienced hydrogen,” stated Lazard and Roland Berger in a new study. The LCOE report then analyses the levelized price of inexperienced and pink hydrogen utilizing PEM and alkaline […]
[…] Read More […]
[…] production levels lower than green hydrogen,” said Lazard and Roland Berger in a new study. The LCOE report then analyses the levelized cost of green and pink hydrogen using PEM and alkaline electrolyzers […]
[…] (LCOE), Storage, & Hydrogen indexes. For the first time in its history, the document has shown pricing increases for solar power’s LCOE. We’re also seeing continued price decreases in hydrogen as that industry […]
[…] Da pv magazine Global […]
[…] von pv magazine International […]
[…] The levelized cost of electricity (LCOE) is a measure used to compare energy sources based on total lifetime costs divided by total energy production. According to the National Renewable Energy Laboratory, the LCOE for utility-scale solar photovoltaics has dropped 88% since 2009, from around $0.37 per kWh in 2009 to $0.04 per kWh in 2021 [1]. In 2022, the global average LCOE for newly commissioned utility-scale solar was around $0.053 per kWh according to IRENA [2]. Despite increases in commodity prices, the International Energy Agency found the global average LCOE for solar increased only slightly in 2022 to $0.096 per kWh [3]. […]