The pv magazine webinar on weather data related to O&M and planning topics initiated a great deal of questions from participants. This prompted Vaisala, our initiative partner for this webinar series, to prepare detailed answers to the most pertinent and insightful questions posed.
Weather data play a big role in both project financing and O&M planning. Essentially, and as many questions returned to again and again, it is the reduction of uncertainty that counts, both in the short term and the long term. For example, typically for projects above 20 MW in size, Vaisala sees a tendency for a measurement station to be installed pre-construction (see below). If this is done, by combining the outcome of this station with satellite data it is possible to reduce that uncertainty by 50%, said Vaisala. This may lead, for example, to advantages when it comes to securing project funding.
Click here to go directly to answers concerning specific topics:
- Q&A related to Vaisala products for weather data and forecast
- Q&A concerning uncertainties and variability
- Q&A related to onsite measurement equipment
- Q&A related to software
- Q&A related to soiling and cleaning
- Q&A related to operations & maintenance
- Q&A related to P-values, financing and uncertainty
Click here to view videos and presentations concerning questions raised during the webinarseries:
- Reducing Solar Performance Uncertainty
- Best Practices for PV Project Development
- Reducing Costs with Smart Maintenance in Solar Asset Management
Questions related to Vaisala products for weather data and forecast
Which specific satellite and ground data are you monitoring and which quantities are you forecasting?
Vaisala: Vaisala's global solar dataset uses satellite data from multiple geostationary satellites, as well as inputs from two of NASA's Earth-observing System (EOS) satellites. Depending on the region of the globe in question, the geostationary satellite data comprise 18+ years of data derived from the GOES 15, GOES 13, Meteosat-10, Meteosat-7, Meteosat-5, and Himawari-8 satellites among several others. The data from NASA's EOS satellites Terra and Aqua are ingested for aerosol inputs. Other aerosol inputs to Vaisala's solar models are data from two re-analysis datasets, ECMWF-MACC and MERRA2. Both datasets assimilate ground-based measurements of atmospheric properties.
Further, validation of Vaisala's global irradiance datasets is carried out using publically available ground-based measurements from various measurement networks across the globe. For example, we validate against data from the Baseline Solar Radiation Network (BSRN), and the World Climate Research Program (WCRP).
The net result of this is a global dataset with nearly two decades of hourly surface irradiance information in the variables of GHI (global horizontal irradiance), DNI (direct normal irradiance), and DIF (diffuse horizontal irradiance), which is updated daily. In addition, Vaisala provides other meteorological variables, such as temperature, precipitation, and wind speed. Along with our historical data, we also provide forward-looking forecasts of weather conditions and power generation for solar and wind projects as well as systems to measure current weather conditions directly, such as our SP-12 Solar Weather Station.
Do you have any examples where more accurate data allowed your customers to be more competitive on a particular solar farm project?
Vaisala: One example would be reducing project uncertainty through our advanced resource assessment approach. We not only use our long-term modeled solar data records to support energy projections, but can combine them with ground station data using sophisticated corrective techniques. We pioneered this methodology in the solar industry and have seen it cut resource model uncertainty by 50% in most cases. In practice, this means our clients have a better chance of securing project funding and at favorable terms. For example, a Japanese developer, installed a ground station and employed Vaisala to carry out this technique at its 33MW Kumenan project and the uncertainty reduction helped it achieve more competitive financing terms.
On the operations side, clients use our daily updated solar data to reconcile recent performance. If energy production was low, reviewing recent weather conditions can explain why. For example, if low production coincided with low solar resources, the cause for the dip in performance is confirmed and this can save significant costs in site visits and field time trying to resolve equipment issues that are simply not there. Conversely, if there no sign of low solar resource, yet performance was low, this likely signals an equipment or maintenance problem to be remedied, which could over time drive down the value of the asset.
Does Vaisala offer high quality datasets for every region in the world? Is the quality always the same or does it depend on the region? Is it more difficult to get such data in underdeveloped countries?
Vaisala: Yes, Vaisala's solar irradiance data cover all land surfaces from 60 degrees N to 58 degrees S. The accuracy of the satellite-derived irradiance data is of the highest quality. Globally our mean bias error is below 5%. However, the exact error percentage varies by region since we are comparing them against different networks of ground stations. In some regions, ground-based measurements are scarce although this is typically a function of government policy, and availability of resource, rather than developed or underdeveloped economies.
Also, our error statistics vary across the five different models we employ and maintain within our entire global database. We use multiple models because some perform better compared to ground-measurements in different regions of the globe. In this way we can offer customers around the world the most accurate data for their region. For more information, please see our newest solar white paper “3TIER Solar Dataset Methodology and Validation”. It was released in April 2017 and features the largest global solar dataset validation ever conducted.
Do you also use aerosol data to reduce spectral uncertainty?
Vaisala: Yes, aerosol data are used in all five Vaisala solar irradiance models, albeit from different sources, to model broadband irradiance data. Three of the five models use aerosol optical depth (AOD) data from the MODIS sensors on the Terra and Aqua satellites, and the other two use AOD data from the European Center for Medium-Range Weather Forecasts – Monitoring Atmospheric Composition and Climate (ECMWF-MACC) and, Modern-Era Retrospective analysis for Research and Applications version 2 (MERRA2).
How can you quantify the effect of snow on a system? Do you also forecast snow and can you predict how thick the snow cover will be?
Vaisala: Information from our global datasets factors in snow and ice analysis. For our Solar Energy Due Diligence analysis, we estimate snow losses using a combination of the Marion model and the Townsend and Powers model. Snow data from MERRA2 are used as inputs to this model. This would take into account the effect of snow from a long-term historical perspective. On the forecasting side, for interested clients we can offer a precipitation and temperature forecast, which would include snow rates. We also have on-site measurement systems that can monitor panel surface state and tell you ice and snow thickness as well as temperature.
Does your forecast for the yield of a solar plant consider temperatures at the site?
Vaisala: Yes, always. Temperature is one of the key sources of energy loss at any solar installation. If on-site measurements are available (one year preferred) we can also correct our temperature forecasts to better reflect local conditions at the project site and enhance accuracy. Our measurement stations also have a back of panel thermistor integrated to give us a better estimate of potential thermal losses at a particular site.
Reducing uncertainty of the forecast increases the amount of leverage a project can support, but does reducing uncertainty also reduce the cost of capital?
Vaisala: Yes, reduced uncertainty also allows for better financing terms and lower interest rates. The equation for uncertainty reduction to cost of capitol improvements is unfortunately specific to each project and the type of financing sought so there’s no easy answer here. But generally, a project with a tighter P50 to P90 ratio is considered to be a less risky investment because there will be smaller annual fluctuations in cash flow. By reducing the risk of the investment for the financier you are #1 more likely to be financed and #2 better able to negotiate for good terms.
Do you use climate indices to do any type of seasonal forecasting?
Vaisala: Yes, we do. For this type of work, typically, a client would engage us on an ongoing basis to help them manage performance across their asset portfolio in a forward-looking manner. For our season-ahead forecasting we use machine learning to evaluate close to 20 different climate indices and match the best performers with the project location. We then provide a forward-looking projection of expected deviations from the typical year’s energy budget going out 12 months, but most of the skill is in the 1-3 month timeframe.
Do you rent onsite weather + stations to help evaluate a site?
Vaisala: Generally, clients would purchase our SP-12 Solar Weather Station and it would become an asset that stays onsite once the project is operational or is moved to a new location if the potential site is found unpromising. The system is quite simple to install and user-friendly to maintain, but we also offer those services if requested. On the resource assessment and forecasting services side, clients contract us to provide either one-off or ongoing information. Clients can chose to engage with us on the measurement systems side or solar energy assessment services side, or both. We have many clients who see the advantage of working with a single provider for both areas.
Q&A concerning Uncertainties and variability
Which would be better for a lower uncertainty of the data: satellite or ground-based sensors? Have you compared for several sites satellite data and ground measured data? If so, how do they compare?
Vaisala: In an ideal world, a multi-decadal ground-based dataset comprising high quality data from well-maintained, regularly calibrated sensors would result in the lowest uncertainty. However, such datasets are few and far between and most available ground stations are either more than 25km away from the site (too far to be useful) or only provide a short-term record of conditions. The next best option is a long-term satellite dataset, which has been adjusted to incorporate onsite ground-measurements, using a site-adaptation methodology for enhanced accuracy. Such an adjustment will remove any bias in the raw model data, and will result in a long-term irradiance data set that reflects the location variability of the solar resource. A third option is to use a raw satellite dataset, which has been thoroughly validated, globally, and has known uncertainty values.
How do you quantify the uncertainty of your weather data and of the data measured on site?
Vaisala: The uncertainty of our raw model irradiance data has been quantified through the largest validation study ever conducted and is based on comparisons between our estimates and ground measurements from nearly 200 stations worldwide (please read our white paper for further details: www.vaisala.com/Vaisala Documents/Scientific papers/3TIER Solar Dataset Methodology and Validation.pdf). Typically, we use the regional uncertainty, also called the standard deviation of mean bias error, associated with the project’s location.
Why do you believe that your weather data are better than data we measure at the solar park?
Vaisala: Our measurement stations uncertainty is calculated depending on the piece of equipment in use. For example, for GHI measurements the uncertainty is associated with the class of pyranometer used. The daily GHI uncertainty varies for different classes. For a secondary standard pyranometer the best class available is 0.8-1.5% and for a first class pyranometer (which most PV installs use) it is 3-5%. The second class pyranometers (the lowest grade) it is 5-7%.
Direct observations from a well-maintained measurement system at a solar site are not necessarily inferior to the satellite based information we provide. On-site measurements do a great job of capturing local environmental conditions. However, the challenge is this information is only available at a single site and is often short-term in duration. Most of our clients need to evaluate projects around the world and thus need access to a global dataset. Before a project is built, they also need long-term data that is generally only available from a multi-decadal satellite dataset like ours in order to deliver the probability of exceedance values required for financing. Combining onsite measurements with long-term satellite data in a site adaption process is the recommended way to get the best of both worlds.
How can you reach 2% uncertainty, when the annual average uncertainty of very good instruments and well-cleaned measurement devices itself hardly reaches 2%?
Vaisala: The +/- 2.5% uncertainty value for the GHI values refers to the resource model uncertainty following site adaption and is referring to the long-term model uncertainty only. The GHI resource model uncertainty without a site adaption is typically closer to 5%. When a site adaption is done the uncertainty associated with the onsite measurements is also pooled into the total resource uncertainty along with interannual variability.
That resource model uncertainty comes from an extensive study we performed where we did a comparison at a dozen sites globally with 3+ years of observational data available. We used a single year of the observations to do the site adaption, called a MOS-correction, and then compared the corrected results to the years not used. The +/- 2.5% is the average of how much the corrected model data deviated from the out of sample years.
How do you achieve such low uncertainty without onsite soiling data?
Vaisala: Actually, for our solar energy due diligence analysis, we do incorporate soiling losses in our energy simulations. The estimate is based on precipitation data from the MERRA-2 reanalysis dataset, and the loss is a function of the amount of rainfall, and a soiling rate based upon a literature review of published studies. When our clients take onsite measurements of soiling we can incorporate that information into our uncertainty estimates but this is rarely done pre-construction these days.
How can you deduce irradiation for an intraday forecast from satellite images, showing cloud cover or fog?
Vaisala: For day- and week-ahead forecasts we actually estimate solar irradiation using numerical weather prediction models. These can be statistically corrected using long-term historical data from our global solar dataset. For near-term forecasting on a sub-hourly basis we are experimenting with sky imagers and other real-time monitoring techniques to improve precision.
How accurate are hour-ahead forecasts? What range of uncertainty can you provide for customers that take part in competitive markets, e.g. spot markets?
Vaisala: Unfortunately, forecast accuracy is highly dependent on the local climate regime so it is difficult to provide a general average or rule of thumb. The uncertainty associated with the forecast (i.e. the prediction interval) is a result of the size of the plant and the prevalence of clouds in the region. Indirectly the historical observation record also plays a role, because it can be used to tune the forecast and reduce overall error and uncertainty. When selecting a provider, uncertainty indicators like prediction intervals or error bands are a key requirement, since no forecast is complete without them.
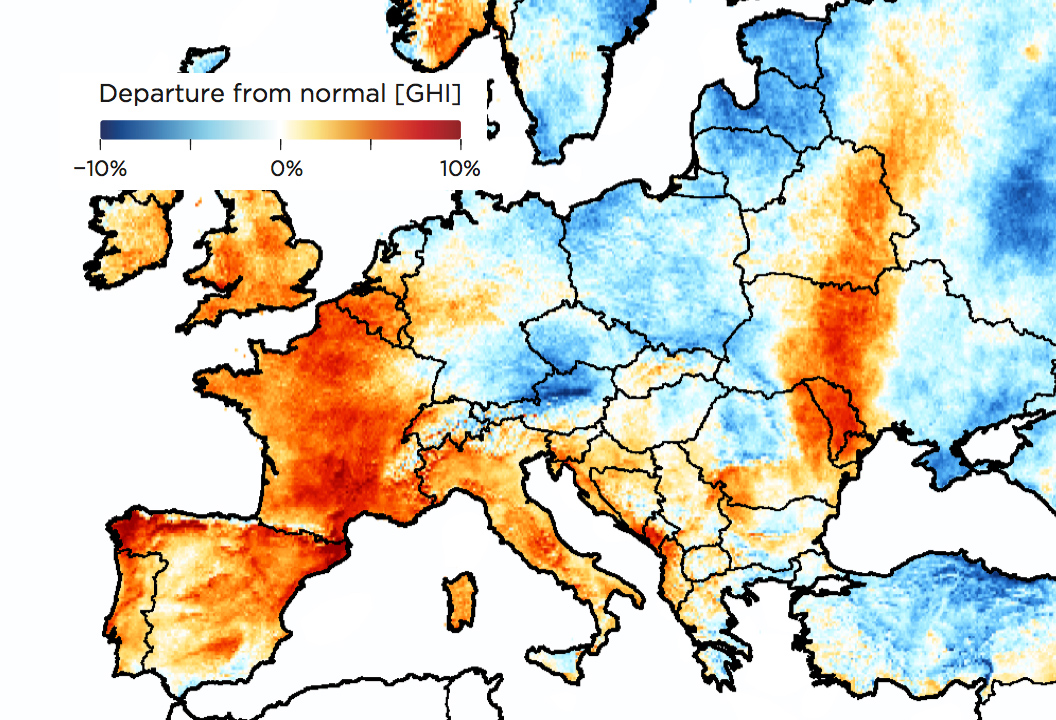
What is the average and what is the maximum deviation of the yearly irradiation?
Vaisala: This depends a great deal on the geographic location and the state of climate indices that influence that region. For example, North American weather is strongly influenced by whether the El Niño-Southern Oscillation (ENSO) cycle is in a positive or negative state. However, I would say it is not uncommon to see annual deviations from average of 3-5% and monthly deviations from average of 5-10%, though 20% or larger monthly deviations do occur during significant weather anomalies.
See this example from North America in 2016.
How does the statistical variation from the average irradiation decreases when you increase the period which you consider? And how does this translate to the forecast: if you forecast the irradiation of one year, you have the full year-to-year-variation as minimum uncertainty, if you forecast the irradiation summed over a period of the next 5 years, you reduce this uncertainty?
Vaisala: In terms of the interannual variability of one year versus 10 years, the variability decreases by the square-root of 10. This makes practical sense because there is much more variation possible during any given year compared to another year than there is during any 1-year period compared to another 10-year period. Over a span of 3-5 years we would expect the average to match pretty closely with the P50 for GHI because the annual variation is not typically that large.
Do you see a relationship between the solar variability and climate change? And how does that influence long-term performance and performance forecasts?
Vaisala: Yes, we do see a relationship. Identifying and quantifying the effects of climate change on solar variability, largely driven by cloud variability, is an active on-going research area at many national science labs and academic institutions around the globe. For a summary of the current research on this topic, we would suggest referring to the IPCC’s most recent assessment of the science of climate change.
For our Solar Energy Due Diligence analysis, we include a climate component in our uncertainty framework, which comprises interannual variability, an estimate of how representative past climate is of future climate, and a component estimating the contribution to uncertainty of a changing future climate.
However, a related factor, pollution, has a more immediate and obvious impact on solar resource and variability. This is because aerosols in the atmosphere reduce the amount of irradiance that reaches the surface. There is strong evidence that increased aerosols in places like India and China in the past five years have reduced solar resources. For this reason, it is particularly important to use up-to-date solar data when estimating project performance in these regions.
What are the criteria with which one can judge that a forecast is good? Is there some statistic value one can ask the provider of the forecast?
Vaisala: To see the advantage of a forecast we would recommend comparing it against an unskilled benchmark like a persistence forecast, which is a good forecast for very short horizons. Many clients also will conduct a trial of the forecast to look at historical performance. In general, most people use mean absolute error as a key criterion. However, some forecasts are more valuable in different markets due to varying rules, imbalance penalties, and price volatility. For example, in a market with high solar penetration, like California, accurate predictions of generation around sunset hours are very important.
Q&A related to onsite measurement equipment
At what scale of the project and in which locations it does make sense to invest in onsite solar monitoring stations? What features of data monitoring hardware and software should EPC's look for to reduce performance uncertainty?
Vaisala: There are always specific project concerns that may swing the decision towards or away from installing measurements such as auction requirements, new market development, or short development timelines. But typically for projects above 20MW in size we see a tendency for a measurement station to be installed pre-construction. And for projects 5MW and larger we always see a station installed for operations monitoring. At smaller projects we often see at least basic measurements for GHI and temperature installed.
To ensure reliable on-site resource data it is recommended that the following variables are measured: irradiance measurements at the very least for GHI and often also at the tilt angle of the panels, preferably from redundant sensors, as well as the weather variables of temperature, precipitation, relative humidity, pressure, and wind speed and direction, which can all be taken with a single sensor for convenience. Another valuable addition to the monitoring station would be a soiling rate measurement.
The sensors should be recently calibrated, and regularly maintained to ensure proper operation over the period of measurement. Siting is also a key factor for a successful measurement campaign i.e., away from obstructions (buildings, trees) or other sources of shading on the irradiance sensors. These sensors should be combined with a reliable data logger, and communications system appropriate for the location. Software packages are available providing real-time data visualization and monitoring tools, for the resource measurement specifically or integrated with power performance monitoring.
How often would you re-calibrate a pyranometer? What would be the cheapest way to do this in isolated locations?
Vaisala: All pyranometer manufacturers have different recommendations for calibration depending on the type of equipment. An average period might be 2 years across different manufacturers and equipment classes. With this in mind it is important to ask equipment providers how long they keep the pyranometers in stock for before selling them as this might impact your timelines. For example,e Vaisala keeps no stock and orders directly from the manufacturers when an order is placed in order to make sure our clients have the longest times between calibration cycles. If you’re concerned about calibration times, you can research which manufacturers have the closest service centers to your project locations.
Q&A related with software
How many different satellite-derived data sets make sense to combine for a thorough solar resource assessment?
Vaisala: Typically, only one. Some firms combine datasets to “reduce uncertainty” but with the likely outcome of a reduction in true resource variability through the averaging process. If you can find a dataset with skill at your project’s location then you want to preserve that not average it with unskilled data.
With that in mind it can make sense to compare several before selecting the most representative dataset. This is a key advantage of our Solar Time Series Tools, which provide five different datasets that can been evaluated and compared with nearby ground observations and their accuracy as demonstrated in our validation study.
What is the source of the degradation data?
Vaisala: Vaisala identifies module degradation through review of manufacturer’s literature, including warranty guarantees, and scientific publications on the topic. We have also called up manufacturers and discussed certain complex situations when needed such as high heat conditions or exceptionally high elevations. We like a good challenge when it comes to energy estimates!
Does the software support near shadings like those of wind turbines?
Vaisala: Vaisala is in a great position to assess hybrid facilities where wind and solar projects are sharing transmission capacity because of our experience in the wind sector. When modeling solar projects that might be impacted from shading by nearby wind turbines we use the complex shade modeling available in PVsyst to identify potential hourly shading losses.
Q&A related with soiling and cleaning
Is it possible to model and predict a soiling rate for a photovoltaic project? And can you estimate cleaning costs from that prediction? If you cannot predict the soiling rate, how can you determine the best time to perform cleaning?
Vaisala: It is possible to model the effect of different cleaning schedules and, based on the energy differences, use that to determine the most effective cost-to-performance cleaning schedule. At Vaisala we use localized estimates for daily soiling rates combined with a precipitation dataset for the project location. We reset the soiling rate to zero when the plant is scheduled to be cleaned or when a precipitation events occurs above a certain amount and duration.
How accurate can you predict dust storms in the MENA region, which is necessary for timing the cleaning? How can we use such a forecast to schedule the best time for cleaning?
Vaisala: We can use historic datasets for aerosolized dust to observe the frequency, duration, and amount of dust in the air over long periods of time. Then we can apply those in our soiling loss models during the energy estimation process. However, the MENA region is unique in its aerosol conditions and is one of the areas where I would recommend putting in a soiling measurement station pre-construction if time allows to help increase the accuracy of the soiling estimates.
Forecasts for the best times to clean can be determined by looking at historic dust datasets and identifying if there are particular seasons effected more by soiling and if cleaning would also increase production sufficiently to offset the costs.
How can soiling losses be estimated on the basis of satellite data? In the webinar you showed an example for a plant that was “overperforming,” but lost five percent by soiling. How was this loss determined?
Vaisala: This was a great example because the client came to us thinking that they were overperforming by 10% but we determined that they had a non-representative resource dataset used in pre-construction and they should have been “overperforming” by 15% of their expectations, which means they were underperforming by 5% of their full potential.
Once we were able to reassess what the expectations should be we looked at the actual performance compared to the modeled results. There were no obvious failures of equipment, wiring, or availability, etc. to cause this reduction. However, their initial assumptions of soiling losses were pretty low and they were only cleaning once a year. Looking at the production in the weeks immediately after cleaning compared to 6 months later we saw the performance ratio was much lower. We identified that about 3% of the underperformance was due to soiling in this way. The rest of the 2% went to the “other” category as further onsite testing would have been needed to track down the remainder.
In an area with moderate or low soiling, what should in your opinion trigger a cleaning event? Is there simple rule of thumb?
Vaisala: Typically, we see people in low soiling areas determine a regular schedule based on an assessment of any local soiling creating events (such as harvesting), rainy season in relation to high production seasons, and so on. Using a long-term dataset of precipitation events it is easy to create an energy estimate and then see how that varies with different cleaning schedules. When there aren’t surprise events like dust storms possible, it is easy to develop a cost-benefit analysis to drive a cleaning schedule.
What roles do you see for automated cleaning? What part of maintenance costs is currently dedicated to cleaning of modules?
Vaisala: We see very different cleaning practices around the world. For example, in India where labor costs are significantly lower and the plants are almost continuously cleaned by teams living onsite. Whereas in the US, plants may only be cleaned once or twice a year because of higher costs.
Automated cleaning is going to be key in locations where labor costs are higher than the potential production gain from cleaning. Operators know they could make more energy if they clean the panels more, but perhaps not enough to justify a cost that could exceed $50,000US for a large plant.
What is your opinion about onsite soiling detector systems?
Vaisala: In the last few months we saw the first real innovation in the soiling detection sector with the release of the Kipp and Zonen DustIQ. The industry now has options for how to approach this problem.
To date the standard system has been two panels and you clean one but not the other. This of course has all sorts of complications related to the availability of a regular cleaning crew, cleaning the correct panels, etc. But it does a good job of measuring the actual electrical loss seen from soiling in the panels. These systems have primarily been installed in operational plants and not pre-construction due to maintenance and equipment costs.
The new DustIQ approaches the problem from a different way by using an optical sensor to estimate the actual level of soiling present on the device. This makes it more useful in pre-construction calculations of daily soiling rates, but it will take a translation of the soiling rate to energy loss in operations which will take a little time to adjust after COD.
Q&A related to Operations & Maintenance
Is it necessary to use daily data to estimate the yield and performance of a photovoltaic project?
Vaisala: We recommend using weather data to develop the expected production to compare against actual performance when assessing performance at an operational plant. Depending on the size of the project there is often onsite measurement data available at an hourly or sub-hourly level to use for performance reconciliation. If it is available, we would suggest primarily using this information.
If there is no onsite information available, then you will want to source satellite-based resource data for the same period of time the project has been operating, not a TMY. You could do the comparison on a daily basis with daily averages, but you will have more flexibility in your analysis using hourly data, particularly if there are gaps in availability or curtailment is occurring.
If an operator follows a more proactive strategy, it can lead to lower return on investment compared to a reactive one, what can an operator do to steer the project in the right direction?
Vaisala: If an operator wants to use a proactive approach to maintenance, then the number one thing they can do is get a good monitoring software package and pay attention to the analytics regularly. Many people take in all kinds of data that they never look at, which makes it as useless as not having it. You need to be familiar enough with what “normal” production looks like that you can start to catch small deviations before they turn into big ones.
Do you compute risk due to downtime (inverter problem, public network problems, etc). Do you have average figures for this?
Vaisala: We do assess for downtime both in pre-construction and operations when estimating long-term energy estimates. This is often regionally varying, particularly when it comes to grid availability. Equipment availability depends on the manufacturers chosen by the developer in pre-construction and actual performance in operations. Curtailment is also a condition to keep in mind, particularly if it can be anticipated in advance of construction. Overall the average annual energy loss for the plant being offline is usually 2-6% depending on location.
Q&A related to P-values, financing and uncertainty
What data should be used to secure financing of a PV plant?
Vaisala: At minimum long-term energy yield should be calculated based on long-term solar resource data (10-20 years) from a high quality, validated source. With this information, the project stakeholders can determine the probability of exceedance values required by most financiers. For the lowest uncertainty and best financing terms possible, incorporating one-year of onsite measurements to correct the long-term reference data is recommended.
What is your methodology for the calculation of P90 values and what financial value has a more accurate P90?
Vaisala: We have different approaches depending on whether the underlying resource data used to run the energy simulation is from a long-term (18 to 20 years) data record, or a typical meteorological year (TMY). If TMY data are used then we develop our uncertainty model, which comprises elements such as aging uncertainty, resource and measurement uncertainty, power modeling uncertainty, and climate uncertainty, assuming the uncertainties are normally distributed. Then P75, P90, P99 values are derived assuming a normal distribution and applying the appropriate probabilities.
If a multi-year resource dataset is used we gain the benefit of knowing the actual interannual variability in energy for a 18 to 20 year period (depending on the location). We use a non-parametric method (i.e., we do not assume a normal distribution) to fit a distribution that describes the individual year energy distribution, and then combine this distribution with our uncertainty categories stated above, to calculate overall uncertainty. We then proceed to calculate the P75, P90, and P99 values as in the previous case.
If uncertainty is calculated for different time periods, e.g. 1 yr, 10 yr, what are the differences and what would you use the different values for?
Vaisala: The differences in the 1yr and 10yr or 20yr periods are primarily resource variability and equipment aging. The variability of the resource is reduced when averaged over longer periods of time. Conversely the aging uncertainty surrounding equipment performance goes up with time as we don’t have many examples of operating 25 year plants to point to.
Do you recommend rather using P70 or P75 values to characterize risk? When would you work with P75-multi-year numbers and when with P75-single-year numbers? How would you consider inter-annual variability?
Vaisala: Typically, it is the ratio between the P50 and either the P75 or more likely the P90 used to assess the risk of a plant. The larger the difference between the values the more risk is assumed in how the plant may potentially perform. A plant will typically be financed based on the expected production at the P75 or P90 levels depending on the risk level a financier is willing to take on.
How do you incorporate measurement uncertainties and inter-annual variations into P50-P99 statistical analysis?
Vaisala: Uncertainties associated with ground-based measurements used to statistically correct our irradiance data vary depending on the sensor classification (e.g., secondary standard and first class). This information is provided by the manufacturers, and is a separate component of our resource uncertainty, itself a component of our overall uncertainty used for estimation of energy probability of exceedance of P-values.
Find more answers in an interviews with Vaisalas expert Gwendalyn Bender “Meteorology matters“ and “Using accurate weather data for asset management and risk reduction”
This content is protected by copyright and may not be reused. If you want to cooperate with us and would like to reuse some of our content, please contact: editors@pv-magazine.com.

5 comments
By submitting this form you agree to pv magazine using your data for the purposes of publishing your comment.
Your personal data will only be disclosed or otherwise transmitted to third parties for the purposes of spam filtering or if this is necessary for technical maintenance of the website. Any other transfer to third parties will not take place unless this is justified on the basis of applicable data protection regulations or if pv magazine is legally obliged to do so.
You may revoke this consent at any time with effect for the future, in which case your personal data will be deleted immediately. Otherwise, your data will be deleted if pv magazine has processed your request or the purpose of data storage is fulfilled.
Further information on data privacy can be found in our Data Protection Policy.